Selected images from the 26 March 2009 blizzard
The following PPI scan is a SOLO presentation of data collected by the NASA N-Pol radar operating with the CSU-CHILL offset feed antenna. (DR=Zdr; PH=phidp) A deep cyclonic-type upslope snow event is in progress:
The next RHI was made on an azimuth of 240 degrees:

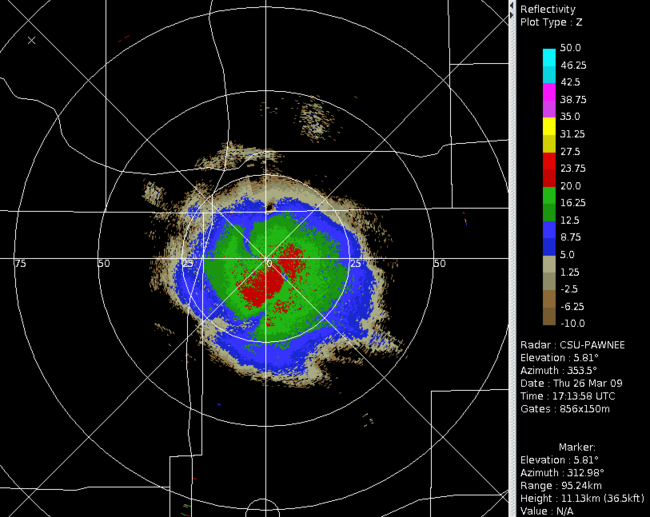
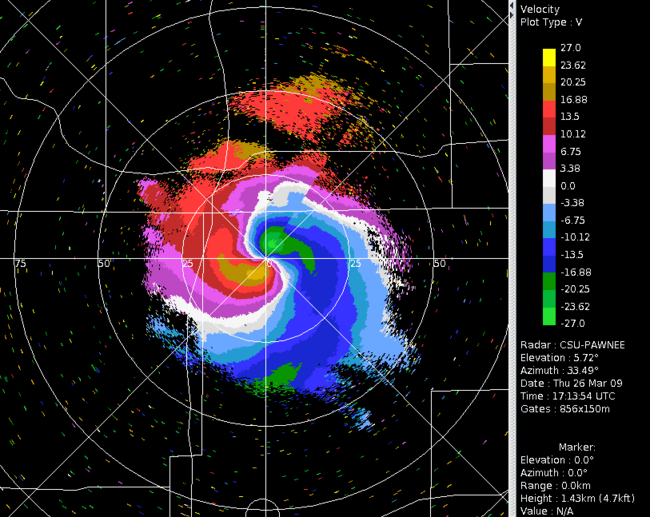
For dual Doppler analysis purposes, the CSU-Pawnee radar is also being operated during this event. The following two PPI images were saved from a VCHILL display that was showing the real time Pawnee data presentation in the CHILL radar user van.
Mid-day update
By 1830 UTC / 1230 MDT echo coverage is starting to decrease in the western azimuth semi-circle. Differential propagation phase shift is most evident in the south eastern quadrant at this time.

20 UTC hour images
Reflectivities have quite generally decreased. The Zdr's are tending to become positive as more pristine / less aggregated snow particles become more common. The phidp field is essentially flat.

The following time series of Platteville wind profiles shows the increasingly deep northerly flow replacing the easterly upslope flow regime that prevailed during this morning's heavier precipitation.

PPI image loop
The following loop is made of 2.3 degree elevation angle N-Pol PPI scans at one hour intervals from 1530 to 0230 UTC on the 27th. The fields show various pulsations during the evening hours. CSU radar operations ended shortly after 03 UTC on 27 March 2009.
|
|
||
|
Aftermath
Snow accumulation at the CSU-CHILL radar site at approximately 0730 MDT on 27 March 2009. (Cat included as a size scale reference.)


