Mixed rain and snow event near Johnstown, CO on 10 January 2002
On 9 January 2002 the Denver NWS office issued a snow advisory for most of the area covered by the CSU dual Doppler network. In an effort to test the dual Doppler network during winter precipitation conditions, the CHILL and Pawnee radars were both operated past midnight local time. This web page presents a small sample of the CSU-CHILL polarimetric data that were collected during the early portion of this event.
Radar Data
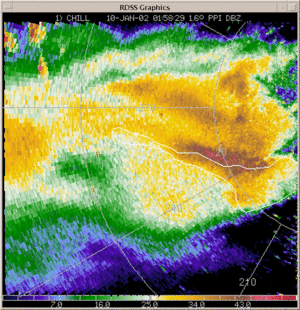
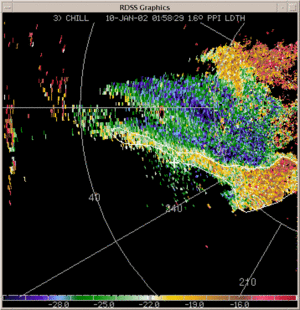
The NWS forecast verified as many snowfall totals on the order of 4 inches were reported on the morning of 10 January. The precipitation was observed to initially develop in an east west band that was roughly centered along a line extending from Loveland through Greeley and further eastwards towards Ft. Morgan. The data examples shown here are from the early stages of the echo area when its coverage was expanding and when both rain and snow were being observed. Figure 1 is the 1.6 degree elevation angle reflectivity PPI data at 01:58 UTC (1858 MST). Of particular note are the strong (>40 dBZ) reflectivity levels seen near the 20 km range ring. The irregular white boundary encloses a band of enhanced linear depolarization ratio (LDR) values (Fig. 2). The LDR data in Fig. 2 have been thresholded at a minimum cross polar channel power level of -102 dBm. This is ~10 dB above CHILL's noise power level.
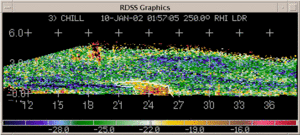
The white "+" in figure 2 is the location of a cooperative weather observer. During a post event telephone interview, this observer reported that only episodes of rain took place before approximately 0445 UTC (2145 MST), when snow began to fall. Thus, the precipitation immediately southwest of the high LDR band at 0158 UTC was rain. The high (> -20 dB) LDR levels in the band probably were probably due to large, irregularly shaped snow aggregates that were melting. This region was probed by an RHI scan at 0157 UTC. The RHI azimuth selected for presentation is 250 degrees. For reference, the range ring labels are plotted at this same angle in Figs. 1 and 2.
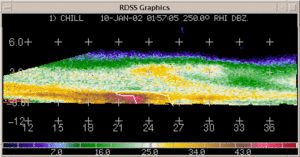
The RHI reflectivity field (Fig. 3) shows that the high reflectivities existed only within ~1 km of the surface. Aloft, a precipitation trail streamed from a generation region centered near X=25, Z=3 km. The shape of the reflectivity patterns suggested that the >40 dBZ surface reflectivity maximum was at the base of another precipitation "streamer" that originated further to the northeast. As in Fig. 1, the irregular white boundary encloses the high LDR region traced from Figure 4. It is apparent that the high LDR region was displaced somewhat to the southwest of the high reflectivity area. (i.e., The high LDR was located closer to the observed rain location. The cooperative observer was at azimuth 252.6 deg / range 25.57 km).
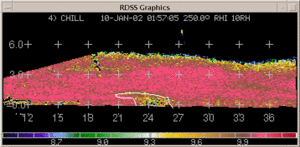
Within the general rain / snow region, the co-polar HV correlation (rhoHV(0)) contained a localized minimum (Figure 5). This correlation is lowered when a wide variety of hydrometeor shapes and sizes coexist in the radar pulse volume. (Note: the rhoHV(0) values have been scaled up by a factor of 10 in this figure).
 |
 |
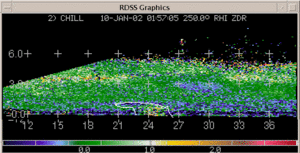 |
Differential reflectivity (ZDR) values became slightly positive towards the southwest edge of the high reflectivity area (Figure 6). These positive ZDR's imply that the major axes of the particles were tending to become more horizontally oriented. (i.e., the normal orientation for raindrops).
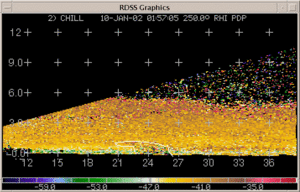
Finally, the propagation differential phase (phidp) field showed some evidence of locally disturbed values in the rain / snow region (Figure 7). The fluctuations in the phidp range profile are symptomatic of differential phase shift upon backscatter (delta). Zrnic et. al (JAM 1993, 678-693) have shown that such phase shifts can occur at S-Band when suitably large, wet aggregates are present.
Summary
The rain / snow boundary shown in these data appeared to be a localized feature. It came about when a precipitation streamer provided a supply of snow particles that were large enough to survive a descent all the way to the surface (where the air temperatures were slightly above freezing). Across this boundary, the radar observations are in agreement with an earlier study of the polarimetric characteristics of winter precipitation by Ryzhkov and Zrnic (JAM 1998, 1228-1240). In particular, they relate the range variations observed in the polarimetric variables during a quasi-horizontal transect through a rain / snow boundary to the sequence noted in a vertical profile through a bright band. When moving across the boundary from the frozen precipitation side towards the liquid precipitation side, the expected sequence is: dBZ max, rhoHV(0) minimum, ZDR maximum. Also, Illingworth and Caylor (24th Radar Conference Proceedings, 1989, 323-327) have noted that melting snowflakes generate distinctly large S-Band LDR values in the brightband.
The presented images represent only a few minutes of the CSU radar data that were collected during this event. Considerably more detailed analyses are possible.
References
- D. S. Zrnic, N. Balakrishnan, C. L. Ziegler, V. N. Bringi, K. Aydin, T. Matejka: Polarimetric Signatures in the Stratiform Region of a Mesoscale Convective System Journal of Applied Meteorology, 32, Issue 4 (April 1993) pp. 678-693
- A. V. Ryzhkov, D. S. Zrnic: Polarimetric Method for Ice Water Content Determination Journal of Applied Meteorology 37, Issue 10 (October 1998) pp. 1228-1240