Melting hail signatures on 8 July 2008
Introduction
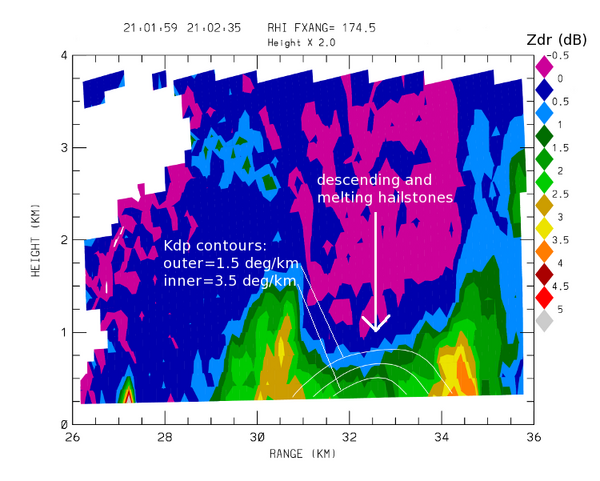
The vertical profile of differential reflectivity () can be used to identify where melting is occurring as hydrometeors fall towards the ground. Once the hydrometeors have fully melted into liquid raindrops, the aerodynamic forces acting on the falling drops cause them to assume a flat-bottomed, oblate mean shape. This flattening increases the horizontally-polarized return signal strength relative to vertically-polarized return signal strength, producing positive values. When the particles are still frozen, their ice structure resists aerodynamic deformation. Also, the orientation of many larger, quasi-spherical ice particles such as hailstones undergoes appreciable wobbling during terminal velocity descent. The combination of these effects tends to equalize the horizontally and vertically polarized return signal levels producing near 0 dB levels. An example of polarimetric radar melting signatures can be seen an RHI scan made by the CSU-CHILL radar on 8 July 2008.
Reflectivity ()
The RHI azimuth intersected a high reflectivity precipitation shaft centered at a range of 32 km.

Differential Reflectivity ()
The following plot shows the field using color-filled contours. The near-zero dB Zdr area reaches its lowest heights in the high reflectivity precipitation shaft. values become positive near the surface as an increasing fraction of the hydrometeors melt into oblate raindrops. The more massive hail particles have high fall speeds and require more time to melt, so the development of positive values is depressed to lower heights above the ground in the echo core. This melting hail pattern has been documented by Wakimoto and Bringi (MWR 1988, 1521-1539).
Also, as the concentration of flattened raindrops in the radar beam path increases, the phase of the horizontally-polarized return signal increasingly lags relative to that of the vertically-polarized signal. The rate at which this H vs. V phase lag accumulates per kilometer of range defines the specific propagation differential phase (Kdp). In the plot below, the Kdp field at the base of the echo core is shown by the solid contours. The instantaneous rain rate can be estimated from Kdp using power law relationships. For S-Band radars, this relationship is approximately R(mm/hr)=42. * (Kdp(deg/km)**.87). (The coefficient values are dependent on the assumed mean relationship between raindrop size and oblateness.) Thus, the development of several deg / km Kdp magnitudes indicates that melting has produced enough raindrops to generate rain rates on the order of 100 mm /hr in the lowest few hundred meters of the echo core. This configuration of a “ trough” intersecting a Kdp maximum in RHI scans through thunderstorm precipitation shafts has been reported by Scarfenberg (AMS Seattle radar conference (2003), Vol 2, 581-584)

Radial Velocity (VR)
The heat absorbed by the melting ice particles acts to locally cool the air in the precipitation shaft. This cooling promotes downward acceleration of the air through negative buoyancy effects. The interaction of this downdraft with the underlying terrain generates the surface-based diverging airflow pattern depicted in the following radial velocity plot. (At the time of this RHI scan, the divergence pattern has expanded beyond a horizontal scale of 4 km, so the outflow has progressed from a microburst to a macroburst.


