DPWX/Cold frontal passage at the CSU-CHILL radar site: 1 October 2014
Author: Patrick C. Kennedy

CSU-CHILL radial velocity data in a low elevation angle surveillance scan taken as a well-defined cold front approached the radar site from the northwest on 1 October 2014. Time lapse loops of the reflectivity and radial velocity data recorded during this frontal passage have been assembled.
Overview
A sharp surface cold front passed the CSU-CHILL site during the early afternoon hours of 1 October 2014. This frontal passage was accompanied by a fine line echo in the radar data and by an arcus formation in the nearby cloud field.
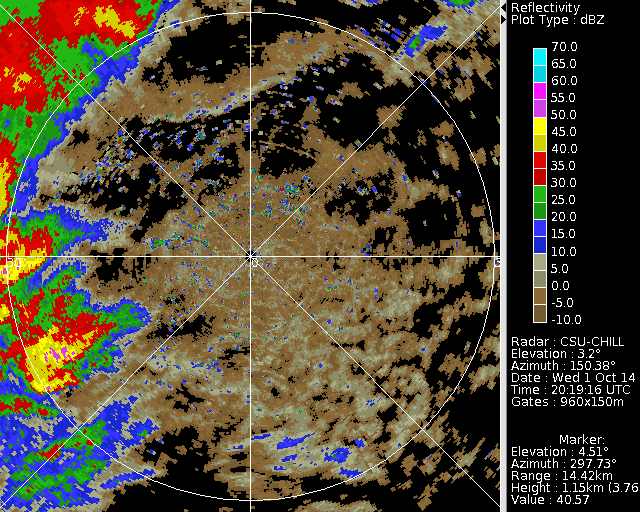
Reflectivity loop
The following reflectivity loop was assembled from a series of low elevation angle PPI scans as the the cold front passed the radar site. The radar scan strategy was changed during the time period covered in the loop: The fixed angle in the first three frames is 2.2 degrees; the last two frames are at 3.0 degrees. (At the times when these images were extracted, the elevation angle shown in the lower right annotation block had moved upwards towards the next next sweep.) The time step between the images is nominally 5 minutes. The progression of the fine line echo associated with the convergence along frontal boundary is evident. Thunder was audible at the CHILL site as some of the more intense showers passed by near the radar:
|
|
||
|
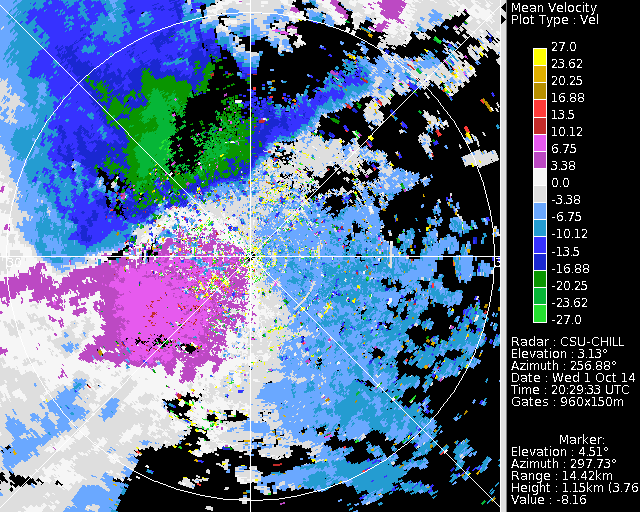
Radial velocities before and after the frontal passage
The following "loop" is composed of two frames showing the low-level radial velocity pattern before (~2030 UTC) and after (~2055 UTC) the frontal passage. Use of the "Forward" button to toggle between the two images is suggested. In the pre-frontal passage time shown in the first image, light easterly wind speeds are indicated by the maxima in negative velocities located on an azimuth of ~100 degreees. In the post-frontal conditions shown in the second image, the inbound wind direction has shifted to the northwest with speeds of ~25 mps. Small regions of negative / inbound (green) radial velocity values located just southeast of the radar are due to velocity aliasing. The strong surface winds produced areas of blowing dust. Selected data collected by the AWOS-3 automated surface weather observing equipment at the Greeley Weld County Airport (KGXY) is shown in the following table:
| Time (UTC) | Wind direction (deg) | Wind speed (knots) | Temperature (deg C) |
|---|---|---|---|
| 2035 | 070 | 13 gusting to 17 | 18 |
| 2115 | 320 | 33 gusting to 40 | 7 |
|
|
||
|
Arcus cloud
The following picture was taken looking southwestward from the CSU-CHILL site at 2041 UTC, shortly after the surface winds had shifted to the northwest and become strong and gusty. The low-based cloud line oriented along the axis of the fine line echo showed some of the horizontal roll characteristics associated with arcus clouds. Ref This cloud was maintained by the enhanced upward motions driven by the convergence along the advancing cold frontal boundary.

Summary
Low elevation PPI scans can effectively monitor the location and progression of airmass boundaries that generate fine line echoes. The associated radial velocity patterns are useful in characterizing the intensity of the wind shifts along these boundaries.