Thunderstorm passage over a tipping bucket rain gauge: 4 September 2013: Difference between revisions
From CSU-CHILL
Pat kennedy (talk | contribs) No edit summary |
Pat kennedy (talk | contribs) No edit summary |
||
| Line 1: | Line 1: | ||
[[Image:4sept2013 RHI Z Kdp anot.png|300px|right]] | |||
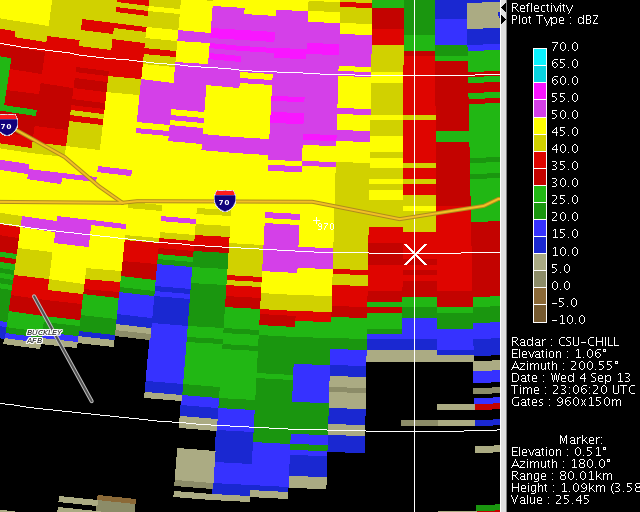
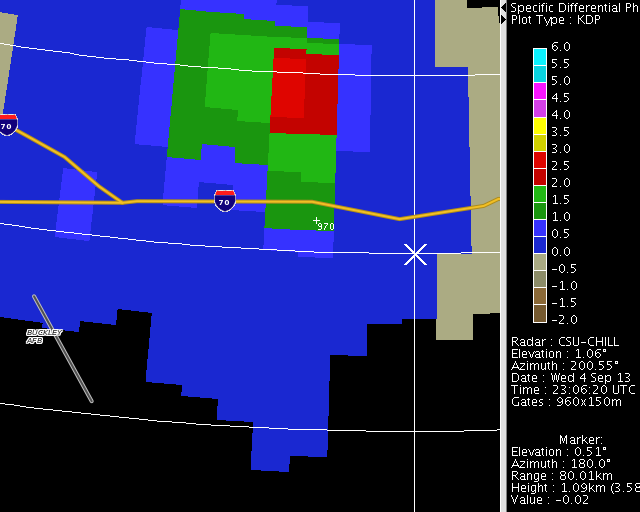
CSU-CHILL S-band data collected in an RHI scan through a thunderstorm that produced high rainfall rates at a tipping bucket rain gauge located 79 km south of the radar. Combined time histories of reflectivity, Kdp, and the rain gauge data have been prepared. | |||
[[Image:Zh 4sept2013 anot.png|center]] | [[Image:Zh 4sept2013 anot.png|center]] | ||
Revision as of 15:06, 23 December 2013

CSU-CHILL S-band data collected in an RHI scan through a thunderstorm that produced high rainfall rates at a tipping bucket rain gauge located 79 km south of the radar. Combined time histories of reflectivity, Kdp, and the rain gauge data have been prepared.


Reflectivity loop
|
|
||
|
Specific propagation differential phase loop
|
|
||
|


Under-reporting errors at rates of 50 mm/hr and above: Humphrey et al JTEC 1997 p1513-1519