Thunderstorm passage over a tipping bucket rain gauge: 4 September 2013
Author: P. C. Kennedy

CSU-CHILL S-band data collected in an RHI scan through a thunderstorm that produced high rainfall rates at a tipping bucket rain gauge located 79 km south of the radar. Combined time histories of reflectivity, , and the rain gauge data have been prepared.

Overview
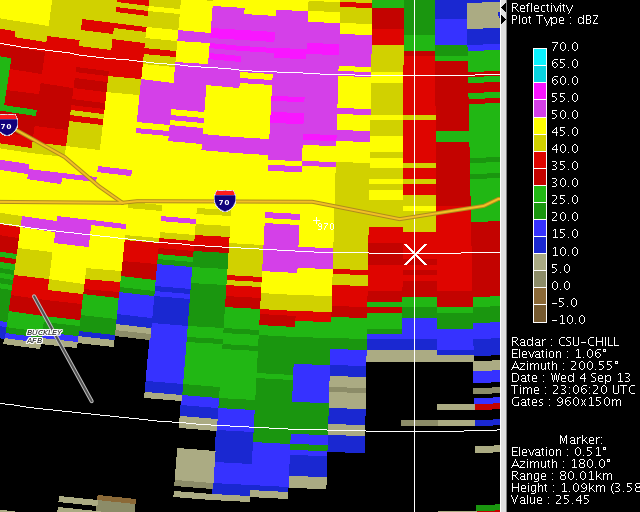
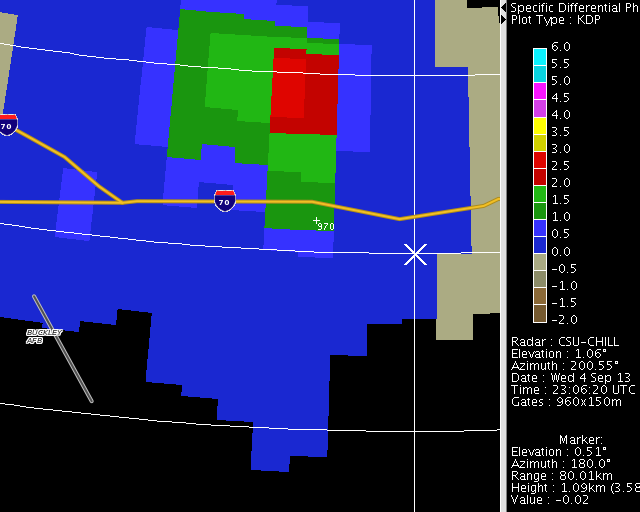
An isolated thunderstorm that occurred within ~12 km of the southern boundary of Denver International Airport (KDEN) was observed by the CSU-CHILL radar during the late afternoon hours of 4 September 2013. Data collection was done using narrow (40 degree wide) PPI sector scan volumes composed of four elevation angles that ranged from 0.5 to 1.8 degrees. This scan pattern produced a volume repeat time interval of ~52 seconds. A portion of the strong echo core passed over a tipping bucket rain gauge included in the ALERT network operated by the Denver Urban Drainage and Flood Control District (UDFCD). The location of this gauge (#970 / Aurora Airpark) is shown just inside the 80 km range ring in the following two PPI images. High reflectivity and positive differential reflectivity values typical of heavy rain were over the gauge location at ~2317 UTC:


Reflectivity loop
The following loop is composed of the reflectivity data observed in the 0.5 deg PPI sweeps recorded between 2306:07 and 2333:00 UTC. The signal processor was operating in indexed beam mode, so the individual beam azimuths remain fixed with time. The reflectivity values over the rain gauge maximize at two separate time intervals. A short-lived period of >50 dBZ reflectivity occurred starting in the second loop frame at 2307 UTC followed by a longer duration episode of high reflectivities centered around 2315 UTC.
|
|
||
|
Specific propagation differential phase loop
The next loop shows the specific propagation differential phase () data recorded during the same sweeps / times as in the reflectivity loop shown above. The values also display two peaks that occur in general synchronization with the previously-described reflectivity maxima. The occurrence of high reflectivity and large positive values are both indicative of significant concentrations of oblate raindrops (i.e., high rain rates).
|
|
||
|
Tipping bucket data
The next two plots show a combination of the CSU-CHILL S-band reflectivity and values taken from the single range gate whose location most closely agrees with that of UDFCD gauge 970 and the rain accumulations recorded at each bucket tip. UTC time stamps at three minute intervals are shown across the top of both plot panels. The individual bucket tip data values are shown by red + symbols. The steepness of the line segments defined by the successive bucket tips defines the observed rain rate. The solid line in the following plot shows the reflectivity time history. The two times when reflectivity levels exceeded 50 dBZ are evident:

The next plot shows the history combined with the same tipping bucket data points. Rain rates of ~60 mm / hr began to occur ~2 minutes after the initial positive peak. Rain rates in excess of 60 mm / hr developed shortly after the second, higher magnitude Kdp maximum that occurred around 2317 UTC. The ~60 - 80 mm rain rates implied by the bucket tips are significantly less than the values implied by the magnitudes. (Using the S-band R(Kdp) estimator yields a rain rate of 159 mm / hr for a 5 deg / km one way .) Factors that probably contribute to this discrepancy are:

- The very different atmospheric volumes sampled by the ~30.5 cm (12 inch) diameter rain gauge funnel vs. the ~ 1.3 km wide pulse volume at a range of 79 km.
- The difficulty in accurately calculating Kdp in convective rain cores with small range extent.
- Horizontal winds that reduce the collection efficiency of the gauge opening and alter the drop trajectories between the elevated radar sample volume and the surface gauge location.
- The under-reporting errors that develop in tipping bucket rain gauges as rain rates exceed ~50 mm / hr (Humphrey et al. JTEC 1997, p 1513 - 1519.)

Summary
Efforts to relate radar-based rain rate estimates to precipitation data recorded by surface gauges often face a number of challenges, especially when the distance between the radar and the gauge(s) becomes large. Reasonably good qualitative agreement was found in the simple single range gate / single rain gauge example presented here. These results benefited from the indexed beams and high time resolution that were available in the CSU-CHILL data.
References
- Denver Urban Drainage and Flood Control District real-time status page
- Humphrey, M. D., J. D. Istok, J. Y. Lee, J. A. Hevesi, A. L. Flint, 1997: A New Method for Automated Dynamic Calibration of Tipping-Bucket Rain Gauges. J. Atmos. Oceanic Technol., 14, 1513–1519.