DPWX/X-band radar observations in widespread snow: 31 January 2014: Difference between revisions
From CSU-CHILL
Pat kennedy (talk | contribs) (initial image posting) |
Pat kennedy (talk | contribs) No edit summary |
||
| Line 21: | Line 21: | ||
</imgloop> | </imgloop> | ||
</center> | </center> | ||
==RHI data== | |||
[[Image:31jan2014 0517 rhi phi curve.png|center]] | |||
[[Image:31jan2014 0517 rhi z anot.png|center]] | |||
Revision as of 16:43, 22 January 2015
Color filled plot of terrain heights (in km above MSL). The CSU-CHILL radar is located at the center of the 100 km x 100 km analysis domain shown by the red box.

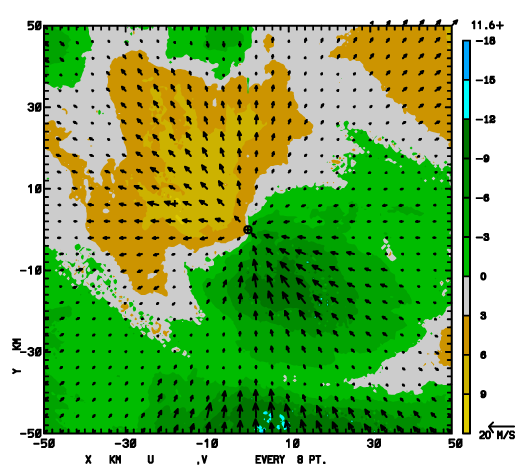
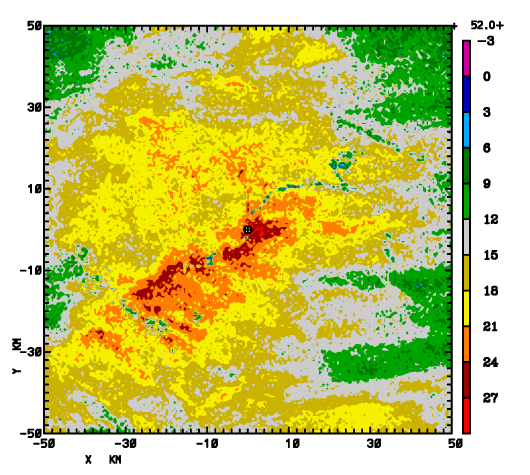
Radial velocity and reflectivity loops at 2 degree elevation angle.
|
|
||
|
|
|
||
|
RHI data

