DPWX/X-band radar observations in widespread snow: 31 January 2014
Author: Patrick C. Kennedy

Horizontal winds veering with height as seen in the radial velocity pattern observed in a PPI scan by the CSU-CHILL X-band system during a snow storm on 31 January 2014. Plots showing the evolution of the radial velocity pattern over a three hour segment of the storm's lifetime have been prepared.
Introduction
Widespread accumulating snow occurred in the vicinity of the CSU-CHILL radar during the early UTC hours of 31 January 2014. To monitor this overnight event, the radar was placed in unattended operating mode with the X-band channel activated and the antenna executing alternating 360 degree surveillance volumes and multi-sweep RHI's. The following plots were selected form the 02 - 05 UTC time period when a general increase in snow intensity occurred.
Upslope flow regime
The CSU-CHILL radar is located ~50 km east of the Front Range of the Rocky Mountains. The following plot shows the terrain height pattern (in Km above mean sea level) in the vicinity of the radar. The radar is located at relatively low elevation in the valley of the Platte River drainage system. Easterly wind flow produces significant upward motions as the air moves over the ascending terrain; some particularly sharp terrain gradients begin ~ 50 km west of the radar.

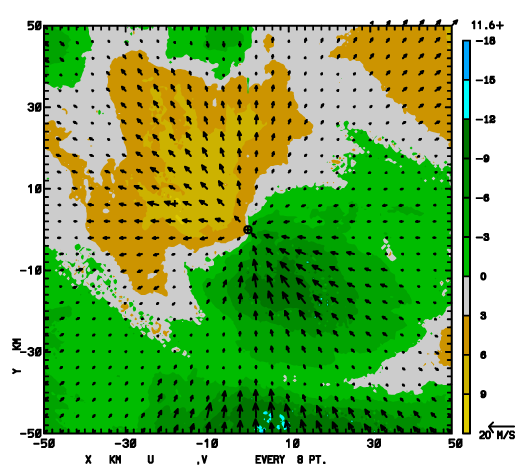
The next two plots show the radial velocity and reflectivity patterns observed in two 2.1 degree elevation angle surveillance scans done three hours apart (0217 and 0517 UTC). The horizontal domain of these plots is the 100 x 100 km square outlined in red in the terrain height depiction shown above. Near the surface (i.e., at ranges within ~20 km of the radar) easterly / inbound radial velocities were apparent at both times. The low level wind direction shifted from southeast to northeast and the speeds noticably increased by 0517 UTC. At greater heights (i.e., longer ranges from the radar), the wind direction veered to the southwest in advance of the synoptic scale mid-tropospheric trough that was associated with the overall precipitation event. (The radially-aligned vector overlay is designed to aid the interpretation of the conventional color-filled radial velocity field.)
|
|
||
|
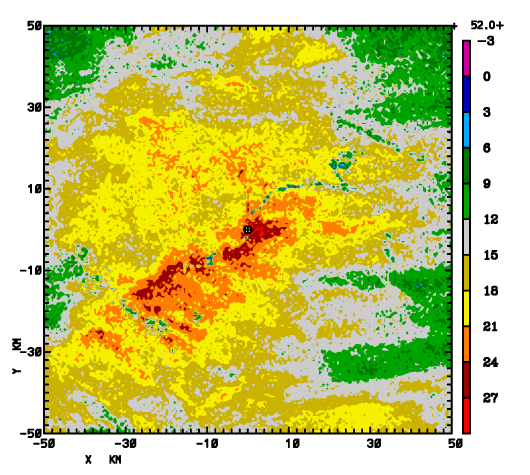
The associated reflectivity fields are shown below. Echo coverage and intensity increased as the low level upslope strengthened. (In addition to terrain effects, dynamically-driven vertical motion patterns were also crucial in organizing these precipitation patterns.)
|
|
||
|
RHI data
Some features of the vertical structure of this snow storm were captured in an RHI scan done on an azimuth of 221 degrees immediately before the 0517 UTC surveillance volume shown above. The following plot shows the differential propagation phase data. As indicated by the manually-applied annotations, the largest phidp accumulations occured in an elevated region located ~3 km above the surface. The phase shifts in this region are probably due to high concentrations of quasi-horizontally-aligned planar ice crystals that were actively growing in the ~ -12 to -15 deg C temperature regime where the vapor pressure difference between ice and supercooled water maximizes. (The -15 deg C level was at 2.9 km AGL in the 12 UTC Denver radiosonde data.) The increased phidp sensitivity available at X-band vs. S-band makes the modest phase shift accumulations generated by oriented ice crystals more evident.

The reflectivity data from the same RHI sweep is shown in the following plot. The reflectivity values increase as the ice crystals aggregate into larger, irregular clumps during their descent towards the surface. The rate of phidp accumulation with range decresases in the near surface layer as the aggregation process leaves a reduced population of pristine ice crystals with quasi-horizontal preferential orientations. Generating cells [Kumjian et al. 2014] are also apparent in the upper levels of the echo system (for example at range=50 km, height= 4 km AGL).

References
- [*Kumjian et al. 2014] Matthew R. Kumjian, Steven A. Rutledge, Roy M. Rasmussen, Patrick C. Kennedy, and Mike Dixon, 2014: High-Resolution Polarimetric Radar Observations of Snow-Generating Cells. J. Appl. Meteor. Climatol., 53, 1636–1658.