DPWX/Thunderstorm passage over a severe weather spotter site: 30 June 2016: Difference between revisions
Pat kennedy (talk | contribs) (Adding rainfall maps.) |
Pat kennedy (talk | contribs) (Starting text additions.) |
||
| Line 1: | Line 1: | ||
==Overview== | |||
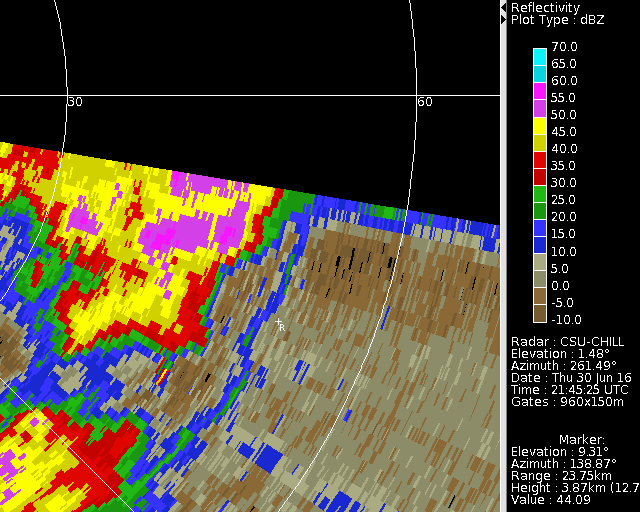
During the afternoon hours of 30 June 2016 test operations that involved low elevation angle PPI sector scans were conducted at the CSU-CHILL radar facility. The resultant 0.5 degree elevation angle sweeps that updated each minute provided high time resolution observations the day's thunderstorm activity. According to Storm Prediction Center spotter reports, one of the thunderstorms produced 1.2 inches of rain during a 20 minute period (2200 - 2220 UTC). The one minute time resolution CSU-CHILL radar observations captured the storm passage at the SPC spotter's location. | |||
==Reflectivity loop== | ==Reflectivity loop== | ||
The evolution of the low level reflectivity field is shown in the following reflectivity loop. The + mark labeled with an "R" indicates the location of the storm spotter report. During the early portion of the loop, the fine line echo associated with the leading edge of the storm outflow crossed the spotter location. Maximum reflectivities briefly exceeded 60 dBZ. | |||
<center> | <center> | ||
| Line 45: | Line 48: | ||
==Differential reflectivity loop== | ==Differential reflectivity loop== | ||
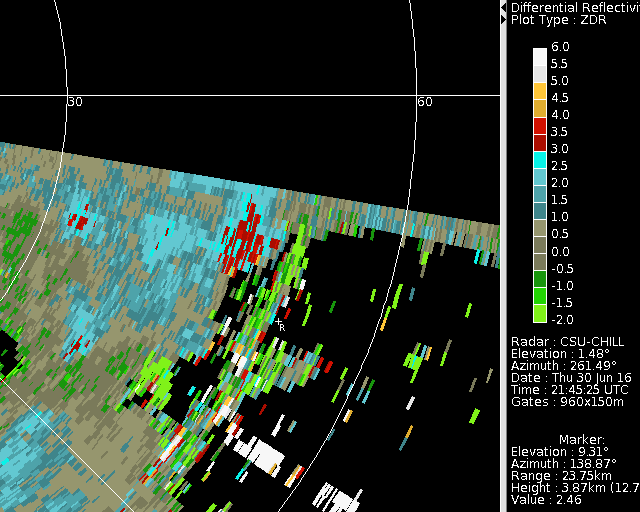
The next loop shows the corresponding differential reflectivity loop. The most positive (~ +3.5 dB) Zdr values occurred during the initial portion of the storm passage. This was probably due to updrafts in the leading portion of the storm that reduced the concentration of smaller diameter, more spherically shaped drops. The remaining larger diameter drop population had more oblate equilibrium shapes and consequently produced more positive Zdr levels. During the high reflectivity period (frame 20, ~2204 UTC), Zdr values decreased to less than +1 dB. This is consistent with the mixture of hail and heavy rain the the SPC spotter also reported. | |||
<center> | <center> | ||
<imgloop delay=200 imgprefix="http://www.chill.colostate.edu/anim/30jun2016_spc_1.2/" width=640 height=512> | <imgloop delay=200 imgprefix="http://www.chill.colostate.edu/anim/30jun2016_spc_1.2/" width=640 height=512> | ||
ZDR.CHL20160630_214456 fx_ppi PPI Sweep 01 Plot 0.png | ZDR.CHL20160630_214456 fx_ppi PPI Sweep 01 Plot 0.png | ||
ZDR.CHL20160630_214556 fx_ppi PPI Sweep 01 Plot 0.png | ZDR.CHL20160630_214556 fx_ppi PPI Sweep 01 Plot 0.png | ||
ZDR.CHL20160630_214656 fx_ppi PPI Sweep 01 Plot 0.png | ZDR.CHL20160630_214656 fx_ppi PPI Sweep 01 Plot 0.png | ||
| Line 89: | Line 92: | ||
</center> | </center> | ||
==Selected 2204 UTC observations== | |||
[[Image:30jun2016 2204 SPC z anot.png|center]] | [[Image:30jun2016 2204 SPC z anot.png|center]] | ||
Revision as of 05:20, 27 July 2016
Overview
During the afternoon hours of 30 June 2016 test operations that involved low elevation angle PPI sector scans were conducted at the CSU-CHILL radar facility. The resultant 0.5 degree elevation angle sweeps that updated each minute provided high time resolution observations the day's thunderstorm activity. According to Storm Prediction Center spotter reports, one of the thunderstorms produced 1.2 inches of rain during a 20 minute period (2200 - 2220 UTC). The one minute time resolution CSU-CHILL radar observations captured the storm passage at the SPC spotter's location.
Reflectivity loop
The evolution of the low level reflectivity field is shown in the following reflectivity loop. The + mark labeled with an "R" indicates the location of the storm spotter report. During the early portion of the loop, the fine line echo associated with the leading edge of the storm outflow crossed the spotter location. Maximum reflectivities briefly exceeded 60 dBZ.
|
|
||
|
Differential reflectivity loop
The next loop shows the corresponding differential reflectivity loop. The most positive (~ +3.5 dB) Zdr values occurred during the initial portion of the storm passage. This was probably due to updrafts in the leading portion of the storm that reduced the concentration of smaller diameter, more spherically shaped drops. The remaining larger diameter drop population had more oblate equilibrium shapes and consequently produced more positive Zdr levels. During the high reflectivity period (frame 20, ~2204 UTC), Zdr values decreased to less than +1 dB. This is consistent with the mixture of hail and heavy rain the the SPC spotter also reported.
|
|
||
|
Selected 2204 UTC observations


Gridpoint values (inches): 2.45, 0.97, 1.23