DPWX/Thunderstorm passage over a severe weather spotter site: 30 June 2016
Author: Patrick C. Kennedy

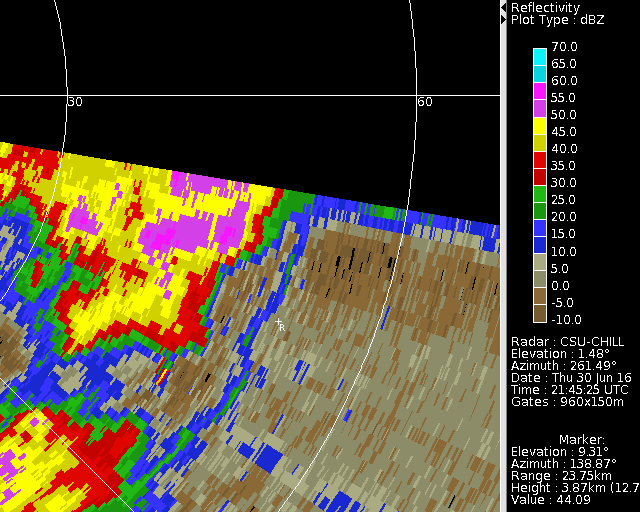
CSU-CHILL 0.5 deg elevation angle PPI scan through a severe thunderstorm that produced a 70 mph wind gust near Wiggins Colorado on 30 June 2016. The radial velocity data contains a well-defined divergence pattern in the vicinity of the 55 dBZ reflectivity core. A storm spotter also reported 1.4 inches of rain in 20 minutes from this storm. Time lapse loops of the storm's passage over the spotter's location have been prepared.
Overview
During the afternoon hours of 30 June 2016, test operations that involved low elevation angle PPI sector scans were conducted at the CSU-CHILL radar facility. The resultant 0.5 degree elevation angle sweeps that updated each minute provided high time resolution observations the day's thunderstorm activity. According to Storm Prediction Center spotter reports, one of the thunderstorms produced a 70 mph wind gust and 1.4 inches of rain during the 20 minute period ending at 2219 UTC. The one minute time resolution CSU-CHILL radar observations captured the storm passage at the SPC spotter's location.
Reflectivity loop
The evolution of the low level reflectivity field is shown in the following reflectivity loop. The + mark labeled with an "R" indicates the location of the storm spotter report. During the early portion of the loop, the fine line echo associated with the leading edge of the storm outflow crossed the spotter location. Maximum reflectivities briefly exceeded 60 dBZ.
|
|
||
|
Differential reflectivity loop
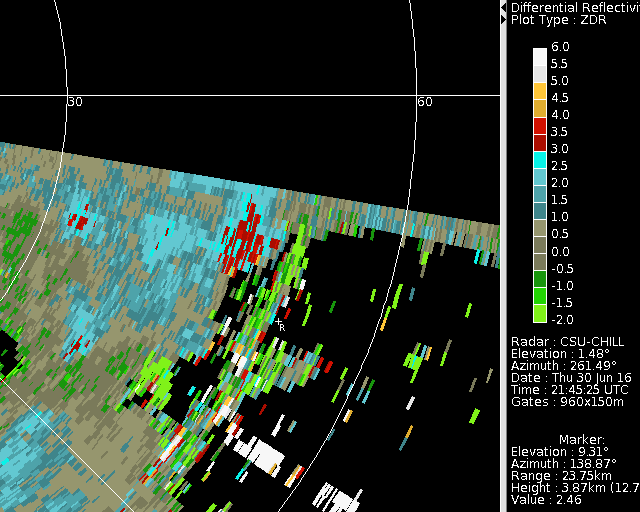
The next loop shows the corresponding differential reflectivity sequence. The most positive (~ +3.5 dB) Zdr values occurred during the initial portion of the storm passage at the spotter's location. This was probably due to updrafts in the leading portion of the storm that reduced the concentration of smaller diameter, more spherically shaped drops. The remaining larger diameter drop population had more oblate equilibrium shapes and consequently produced more positive Zdr levels. During the high reflectivity period (frame 20, ~2204 UTC), Zdr values decreased to less than +1 dB. This is consistent with the pea-sized hail that the the SPC spotter also reported.
|
|
||
|
Selected 2204 UTC observations
The following plots obtained from a spatially smoothed version of the 2204 UTC 0.5 degree elevation angle PPI sweep show selected data values from the most intense storm portion of the storm's passage. As noted earlier, reflectivity reached ~ 60 dBZ near the spotter's location (marked as SPC).

The next plot shows the Hail Differential Reflectivity (HDR) value as presented by Aydin et al (1986). This quantity is based on the joint consideration of reflectivity and differential reflectivity. In essence, positive values of HDR indicate an increasing probability of hail. The +3 to +9 dB HDR values at the spotter's location imply that the presence of quasi-spherical hailstones reduced the Zdr in some portions of the echo core below the levels that would be associated with precipitation composed only of oblate raindrops.

The final plot shows the one way specific propagation differential phase field based on the methods of Wang and Chandrasekar (2009). The high (5 - 6 deg / km) Kdp values imply instantaneous rain rates of ~ 150 to 200 mm per hour.

Rain accumulation maps
The spotter report of a 1.4 inch rain accumulation during the overall 20 minute storm event provided a reference point for rainfall estimates based on the CSU-CHILL radar data. These radar-based were developed by interpolating all the radar data fields to a .5 km by .5 km Cartesian grid on the 0.5 degree elevation PPI surface. Rain rates from various radar estimation methods were calculated at each gridpoint for each PPI sweep. These rates were integrated over the 2149 - 2218 UTC time period to approximate the spotter's reporting period. The first plot shows the result of using the WSR-88D relationship of R = 0.017 *Z**0.714) where Z is expressed in linear units. Probably due to the reflectivity enhancement from the hailstones, the radar estimated rainfall at the spotter's location is excessive. (It should be noted that the application an upper reflectivity limit of 55 dBZ substantially reduced the rainfall overestimation at the spotter location.)

The final plot shows the rainfall estimated from the Kdp data using the relationship R=40.5*Kdp**0.85. Since quasi-spherical hailstones cause relatively limited differential propagation between the horizontally and vertically polarized radar waves, Kdp is less influenced by the presence of hail. In this case, the Kdp-based rainfall total (~1.23 inches) provides a fair approximation of the spotter's report of 1.4 inches.

References
Aydin, K., T. A. Seliga, and V. Balaji, 1986: Remote sensing of hail with a dual linear polarization radar. Journal of Climate and Applied Meteorology. 25, 1475-1484.
Wang, Y. and V. Chandrasekar, 2009: Algorithm for estimation of the specific differential phase. Journal of Atmospheric and Oceanic Technology. 26, 2565-2578.