DPWX/Microburst winds and melting hail at the Easton Airport field site: 9 July 2015: Difference between revisions
Pat kennedy (talk | contribs) (initial image loop and partial text) |
Pat kennedy (talk | contribs) No edit summary |
||
| Line 1: | Line 1: | ||
==Overview== | ==Overview== | ||
During the late afternoon and early evening hours of 9 July 2015 (local date) the CSU-CHILL conducted continuous 1.5 degree elevation angle 360 degree PPI scans to collect low altitude dual polarization radar observations of precipitation at the instrumentation site located at the Easton Valley View Airport (azimuth 171.4 deg / range 13 km from CHILL). This site was established in the fall of 2014 to support the Multi-Angle Snow Camera and Radar (MASCRAD) project [ | During the late afternoon and early evening hours of 9 July 2015 (local date) the CSU-CHILL conducted continuous 1.5 degree elevation angle 360 degree PPI scans to collect low altitude dual polarization radar observations of precipitation at the instrumentation site located at the Easton Valley View Airport (azimuth 171.4 deg / range 13 km from CHILL). This site was established in the fall of 2014 to support the Multi-Angle Snow Camera and Radar (MASCRAD) project [link to earlier article] | ||
==Reflectivity loop== | ==Reflectivity loop== | ||
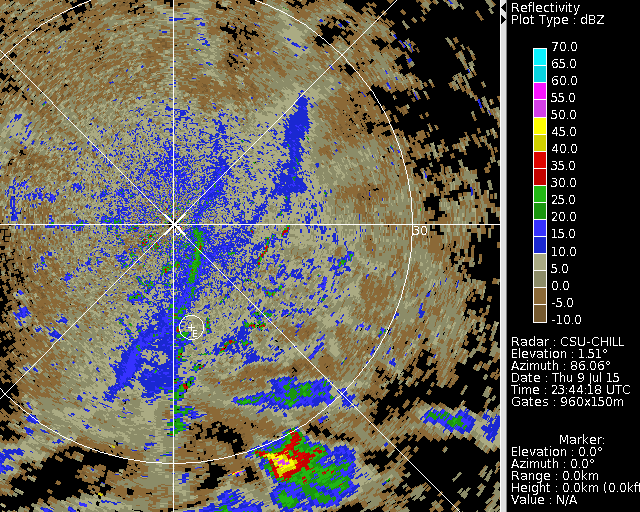
The following reflectivity loop covers the period from | The following reflectivity loop covers the period from 2344 UTC on 9 July to 0052 UTC on 10 July 2015. The time interval between between the images is nominally 1.5 minutes. The motions of the clear air echo patches demonstrate the convergence that was maximized along the fine line echo that was initially located just southeast of the radar. The precipitation shaft from an isolated developing thunderstorm appeared essentially at the Easton site (circled letter E) near 00 UTC. This cell became a part of the large thunderstorm complex that existed in the southeast azimuth quadrant at the end of the loop. | ||
<center> | <center> | ||
| Line 56: | Line 56: | ||
</center> | </center> | ||
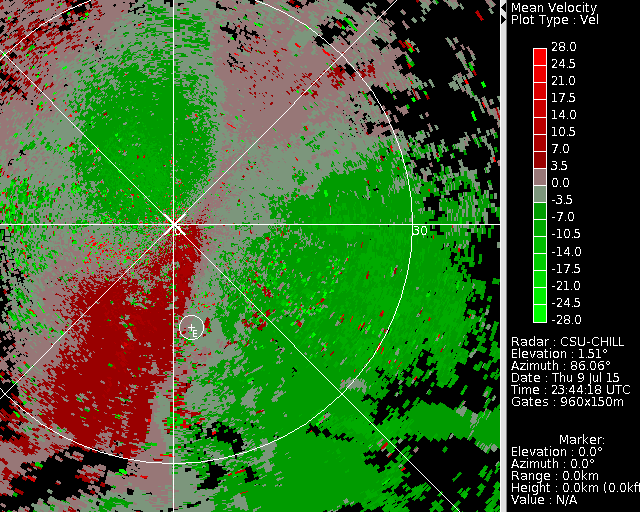
==Radial velocity | ==Radial velocity loop== | ||
The radial velocity field showed a well-defined convergent pattern in the pre-storm boundary layer. By ~0022 UTC the reflectivity core of the storm that had initially developed over Easton had moved ~4 km to the east of the instrumentation site. The downdraft associated with this echo core began to produce a microburst signature at this time (0022:27 UTC / image frame # 26). With time this microburst pattern expanded and was overtaken by the larger scale outflow pattern associated with the thunderstorm complex near the southern edge of the image frame. | The radial velocity field showed a well-defined convergent pattern in the pre-storm boundary layer. By ~0022 UTC the reflectivity core of the storm that had initially developed over Easton had moved ~4 km to the east of the instrumentation site. The downdraft associated with this echo core began to produce a microburst signature at this time (0022:27 UTC / image frame # 26). With time this microburst pattern expanded and was overtaken by the larger scale outflow pattern associated with the thunderstorm complex near the southern edge of the image frame. | ||
Revision as of 15:51, 24 July 2015
Overview
During the late afternoon and early evening hours of 9 July 2015 (local date) the CSU-CHILL conducted continuous 1.5 degree elevation angle 360 degree PPI scans to collect low altitude dual polarization radar observations of precipitation at the instrumentation site located at the Easton Valley View Airport (azimuth 171.4 deg / range 13 km from CHILL). This site was established in the fall of 2014 to support the Multi-Angle Snow Camera and Radar (MASCRAD) project [link to earlier article]
Reflectivity loop
The following reflectivity loop covers the period from 2344 UTC on 9 July to 0052 UTC on 10 July 2015. The time interval between between the images is nominally 1.5 minutes. The motions of the clear air echo patches demonstrate the convergence that was maximized along the fine line echo that was initially located just southeast of the radar. The precipitation shaft from an isolated developing thunderstorm appeared essentially at the Easton site (circled letter E) near 00 UTC. This cell became a part of the large thunderstorm complex that existed in the southeast azimuth quadrant at the end of the loop.
|
|
||
|
Radial velocity loop
The radial velocity field showed a well-defined convergent pattern in the pre-storm boundary layer. By ~0022 UTC the reflectivity core of the storm that had initially developed over Easton had moved ~4 km to the east of the instrumentation site. The downdraft associated with this echo core began to produce a microburst signature at this time (0022:27 UTC / image frame # 26). With time this microburst pattern expanded and was overtaken by the larger scale outflow pattern associated with the thunderstorm complex near the southern edge of the image frame.
|
|
||
|