An RHI scan through a severe thunderstorm: 21 June 2010
Overview
Introduction
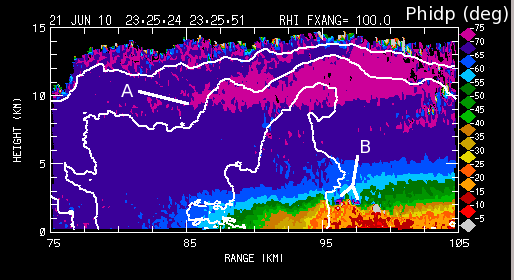
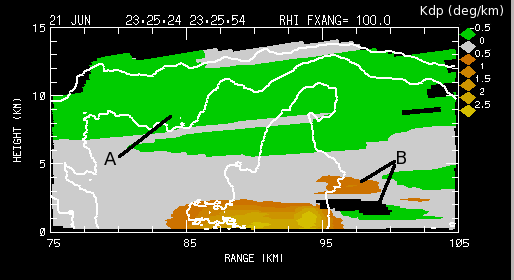
The CSU-CHILL radar observed several severe thunderstorms during the afternoon hours of 21 June 2010. At ~2330 UTC Morgan County Colorado was being affected by this activity. The severe weather reports compiled by the Storm Prediction Center include 1.5 inch diameter hail 1 mile south of Brush at 2316 UTC and 1.0 inch diameter hail and 60 mph wind gusts 5 miles northeast of Brush at 2333 UTC. An RHI volume scan in the vicinity of these severe weather reports was made at 2325 UTC. The sweep done on the 100 degree azimuth captured some notable features.
Reflectivity and radial velocity
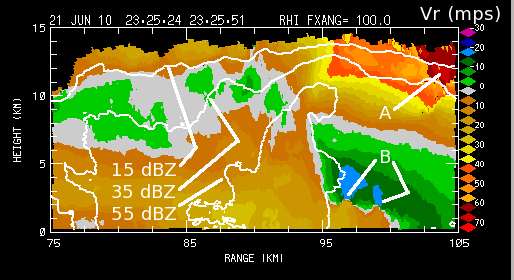
In all of the following plots, the basic reflectivity structure is indicated by three reflectivity levels (15, 35, and 55 dBZ) plotted with solid white contour lines. The unfolded radial velocities exceed 60 mps in the anvil-level outflow region (point A). At low levels, a sharp interface is present between the surface-based outflow and the elevated strong inflow layer. Local velocity couplets along this interface are indicated by point B. Wakimoto et. al. (BAMS, July 1996; Fig. 7) have related similar couplets to Kelvin-Helmholtz instabilities.
Differential reflectivity
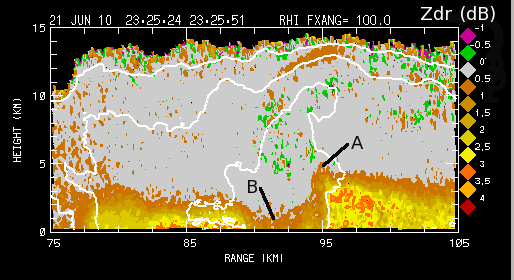
Positive Zdr values reach their greatest heights where oblate raindrops are being carried aloft by the updraft (point A). At low heights within the 55 dBZ echo core (point B), the presence of hailstones reduces the Zdr from the positive values present in the neighboring rain areas.
Linear depolarization ratio
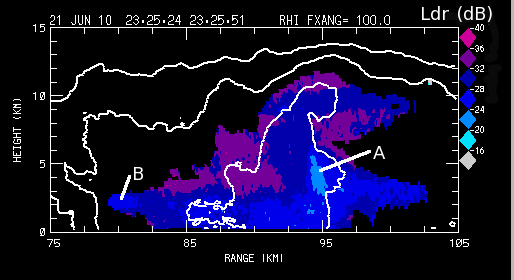
The least negative Ldr values overlap and extend above the positive Zdr column in the updraft region (point A).
