HDR hail map from 9 June 2004
Introduction
During the mid-afternoon hours of 9 June 2004, a damaging hailstorm moved from southwest to northeast across a portion of the greater Denver metropolitan area. As this took place, the CSU-CHILL dual polarization radar was collecting data for the Global Precipitation Measurement mission Pilot Project (GPM Pilot). The radar scanning for this project included a low elevation angle PPI sector scan that repeated at approximately two minute time intervals. These scans provided a high time resolution view of the low level portion of the hailstorm's precipitation shaft.
Hail Differential Reflectivity
The identification of hail in this presentation was done using the Hail Differential Reflectivity (HDR) parameter (Aydin et al, 1986). Differential reflectivity is the ratio between strength of the co-polar signal returns at horizontal and vertical polarizations as expressed on a dB basis


where the reception and transmission polarizations are given be the first and second Z subscripts respectively. The strength of the returned radar signal is directly related to the target particle's diameter in the plane of the illuminating radar pulse. The forces acting on falling raindrops (especially the larger, faster falling ones) cause them to assume a flattened shape (larger cross sectional diameter in the horizontal than in the vertical). This yields a positive value since . In contrast, the ice structure of hailstones generally resists aerodynamic deformation. Also, the orientation of falling hailstones normally gyrates through large angular displacements. The combination of these effects causes the horizontally and vertically polarized return signals from hailstones to be of approximately equal strength. Thus, rain areas will be characterized by positive values, while the presence of hail will decrease to 0dB (when ). The HDR parameter jointly considers the precipitation's reflectivity () and values. The HDR formulation is based on the rain area boundary in , space (the line marked in Figure 1) as defined in Aydin et al (1986).


As shown by the vertical red line in Figure 1, and combinations that are located above the rain limit (i.e., high and low ) result in the positive HDR values that characterize hail. (The rain area lies below the below the boundary. Rain is characterized by negative HDR values).
HDR Readings from CSU-CHILL

An HDR map was plotted from all of the 0.5 degree elevation angle scans that the CSU-CHILL radar conducted between 2:28 and 3:19 PM local time during the afternoon of 9 June 2004. HDR was calculated from the and data at each range gate. Cressman weighting was then used to interpolate the HDR values to a 1 km by 1 km Cartesian grid. The largest positive HDR value calculated at each gridpoint during the radar observation period was retained. A color-coded depiction of the resultant peak HDR swath is shown in Figure 2.
Damage Report
Various forms of ground-based hail observations are included as annotations to the figure. At the four circled locations listed in the lower right corner of the plot, newspaper reports documented significant hail damage. At both the Bear Valley Mall and Southwest Plaza shopping areas the hail impacts caused roof damage which permitted serious interior flooding to occur during the storm's passage. Automobile damage was widespread at the Peak Automotive dealership (Fig 3). At the Foothills Golf course, large hail dented the putting green surfaces (Figure 4).
-

Figure 3: Hail-damaged vehicle sale announcement
-
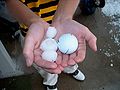
Figure 4: Large hailstones at the Foothills Golf Course
-
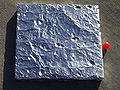
Figure 5: Hailpad at CoCoRaHS station JF179
-
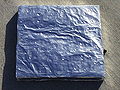
Figure 6: Hailpad at CoCoRaHS station JF144


VCHILL Links
Open Reflectivity PPI in VCHILL