DPWX/RhoHV observations in a developing hailstorm: 16 August 2015
Author: Patrick C. Kennedy

NWS KFTG (Denver) reflectivity data at the 5 km (top) and 3 km MSL (bottom) CAPPI heights at 2127 UTC on 16 Aug 2015. The developing thunderstorm just north of the CSU-CHILL radar has greater reflectivity values at 5 vs. 3 km. The subsequent development of dual polarization hail signatures near the ground has been documented.
Overview
During the afternoon hours of 16 August 2015, an isolated thunderstorm developed rapidly just north of the CSU-CHILL radar site near Greeley, Colorado. During this period the radar was operating in alternating H,V polarization mode while conducting continuous 360 degree surveillance scans at an elevation angle of 1.5 degrees and a scan rate of 4 deg / second. This scan procedure gave a cycle time of ~ 1 minute and 40 seconds, providing a high time resolution view of the evolution of polarimetric radar hail indications. (Note: On this afternoon data from the CSU-CHILL X-band channel was not available; all of the data shown below was collected at S-band / ~11 cm wavelength.)
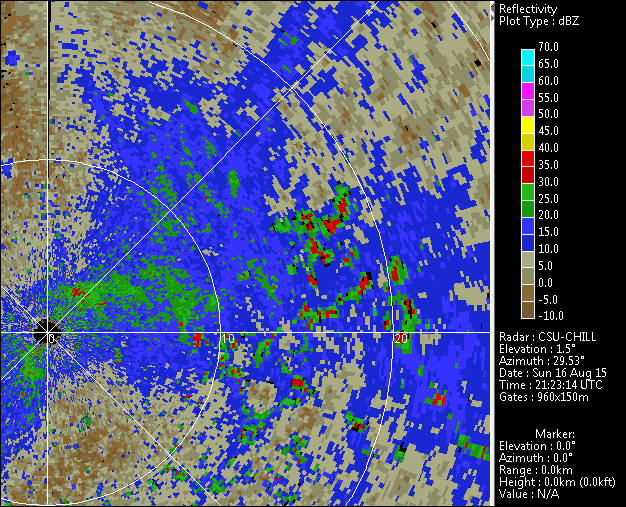
Reflectivity loop
The following loop covers the time period from 2121:44 - 2200:09 UTC. The widespread, weak echo pattern that was initially present was primarily due to insects flying in the warm afternoon boundary layer. Rain from the higher-altitude storm begins to descend into the PPI scan surface ~8 km north-northeast of the radar in the third image frame (2126 UTC). Thereafter, the precipitation reflectivities rapidly intensify and horizontally-expand as the storm moves to the east of the radar.
|
|
||
|
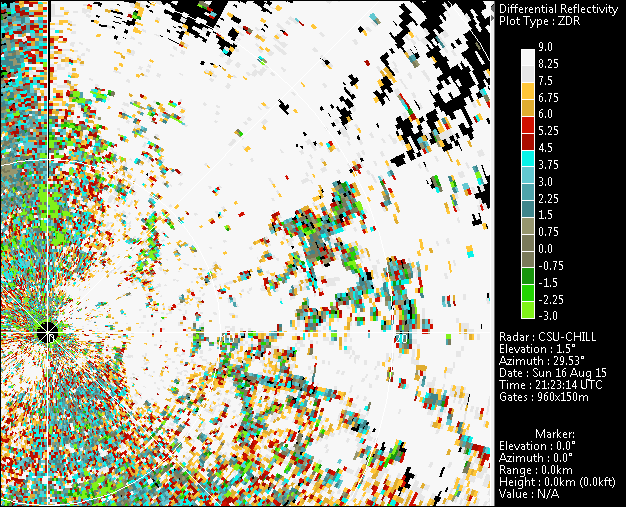
Differential reflectivity loop
The following loop shows the differential reflectivity data that corresponds to the reflectivity evolution shown above. The values are highly positive (> ~ +6 dB) during the pre-storm period. The highly oblate shapes of the insects produce a significantly stronger received signal level at horizontal polarization vs. vertical polarization. Since is proportional to the H/V received signal strength ratio, the insect-laden boundary echo generally has distinctly positive values. Large diameter raindrops have equilibrium shapes that are less oblate than typical insect bodies. This causes the levels to become less positive as raindrops become the predominant scatterer. By frame 14 (~2143 UTC), a well defined region of near 0 dB becomes apparent in the high reflectivity echo core immediately southeast of the 045 degree azimuth line. These near 0 dB values imply that the H and V polarization received signal levels are essentially equal. The presence of hail tends to reduce from the positive values associated with oblate raindrops. The nearly spherical shapes and quasi-random free-fall tumbling motions of hailstones both act equalize the average H and V received signal levels [Herzegh and Jameson 1992]. By the end of the loop, increasing indications of negative become apparent. This may be due to the presence of hailstone diameters of ~2 cm [Balakrishnan and Zrnic 1990]. Storm Prediction Center severe weather reports do contain observations of 1 inch (2.54 cm) diameter hail from this storm around 2200 UTC.

|
|
||
|
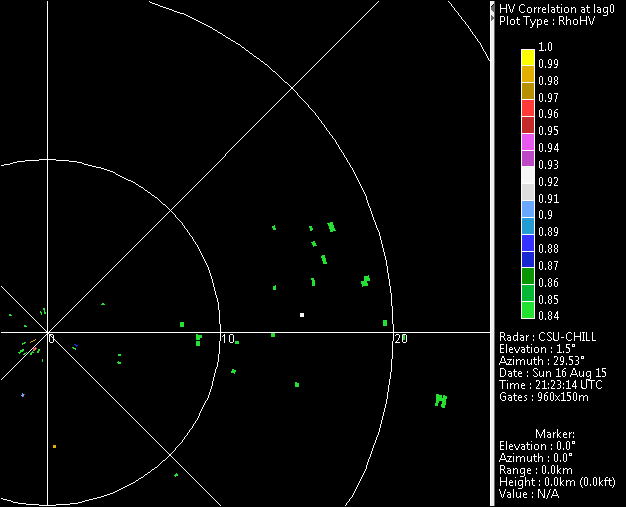
Correlation Coefficient loop
The correlation coefficient between the co-polar H and V returns () provides information on the variability of hydrometeor shapes and orientations in the radar pulse volume. When the hydrometeor physical characteristics are fairly uniform in the pulse volume (all raindrops for example), well designed weather radars can measure correlations in the 0.98 - 0.99 range. Mixtures of diverse particle types, like raindrops and hailstones, reduce correlation levels to ~0.90. Mie scattering effects from suitably large / high dielectric (wet) hailstones can further enhance reductions in areas of hail. The following loop contains organized reductions associated with the hail areas that were implied by the high reflectivity / low Zdr regions seen in the two previous loops. (Note: To eliminate the non-precipitation boundary layer echoes, the data was thresholded at a reflectivity level of 35 dBZ. This causes the initial, essentially blank frames).

|
|
||
|
Specific differential propagation phase (Kdp)
In addition to hail, this storm generated locally heavy rainfall. The color fill the following plot shows the one-way S-band Kdp values near the end of the image loop period. For reference, the 60 dBZ reflectivity contour is shown in white; the grid origin is the CSU-CHILL radar. The very large (~6 - 7 deg / km) Kdp magnitudes imply that peak rain rates of ~200 mm / hr were occurring. A volunteer weather observer in the path of this storm reported a 24 hr rainfall of 1.08 inches and "lots of hail" (diameters not mentioned).

References
- [*Herzegh and Jameson 1992] Herzegh, Paul H., Arthur R. Jameson, 1992: Observing Precipitation through Dual-Polarization Radar Measurements. Bull. Amer. Meteor. Soc., 73, 1365–1374.
- [*Balakrishnan and Zrnic 1990] Balakrishnan, N., D. S. Zrnic, 1990: Use of Polarization to Characterize Precipitation and Discriminate Large Hail. J. Atmos. Sci., 47, 1525–1540.