File:9jun2004 hdr map.png
From CSU-CHILL

Size of this preview: 600 × 600 pixels. Other resolution: 669 × 669 pixels.
Original file (669 × 669 pixels, file size: 37 KB, MIME type: image/png)
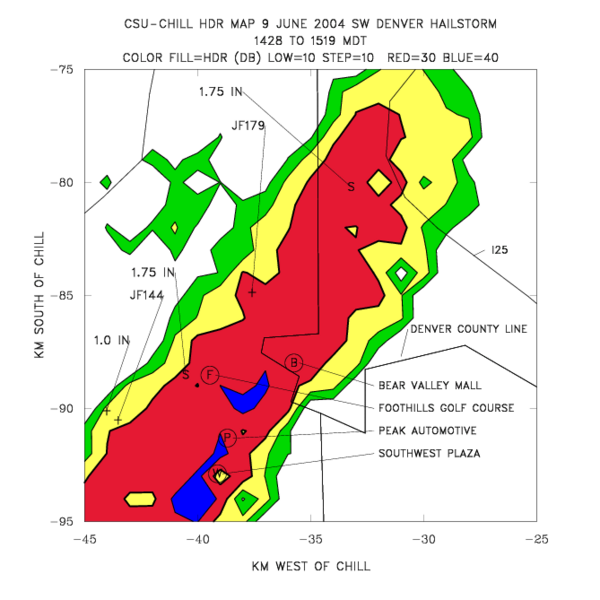
Map of the maximum HDR value recorded during the hailstorm's passage. Base map lines are county boundaries in the southwestern Denver area. Numerical values are hailstone diameters in inches. Reports obtained from the Storm Prediction Center are marked with an "S". Observations from Community Collaborative Rain and Hail Study (CoCoRaHS) observers are marked with a "+"
File history
Click on a date/time to view the file as it appeared at that time.
| Date/Time | Thumbnail | Dimensions | User | Comment | |
|---|---|---|---|---|---|
| current | 11:06, 21 June 2007 | | 669 × 669 (37 KB) | Jgeorge (talk | contribs) | Map of the maximum HDR value recorded during the hailstorm's passage. Base map lines are county boundaries in the southwestern Denver area. Numerical values are hailstone diameters in inches. Reports obtained from the Storm Prediction Center are marked wi |
You cannot overwrite this file.
File usage
The following page uses this file: