Varying outflow boundary motion: 11 September 2012: Difference between revisions
Pat kennedy (talk | contribs) (initial image posting) |
Pat kennedy (talk | contribs) No edit summary |
||
| Line 1: | Line 1: | ||
==Introduction== | ==Introduction== | ||
A series of low elevation angle PPI scans was conducted during the afternoon of 11 September 2012 as a synoptic scale trough approached the area from the west. A boundary layer echo line was located ~50 km north of CSU-CHILL at the start of the observations; this fine was moving towards the south. An area of rain showers subsequently developed ~60 km northeast of the radar. Low level outflow from these showers caused a large portion of the boundary layer echo line to change orientation by ~90 degrees. | |||
==Reflectivity loop== | ==Reflectivity loop== | ||
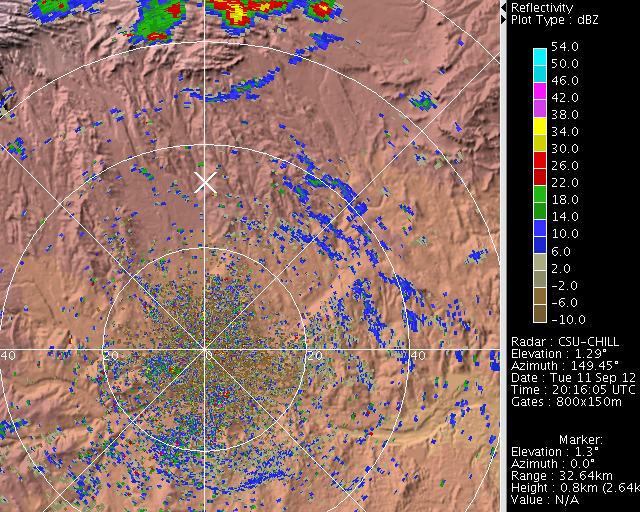
The following image sequence was made from a series of PPI scans at an elevation angle of 1.0 deg. The echo line of interest initially had a west-southwest - east-northeast orientation. Locally-enhanced outflow from the rain showers located approximately 60 km to the northeast of the radar rotated the echo line into a northwest - southeast orientation. The white "X" ~35 km north of the radar marks the approximate pivot point for this rotation. Additional, patchy echo areas are also visible moving towards the northeast in the pre-trough synoptic flow. | |||
<center> | <center> | ||
<imgloop delay=200 imgprefix="http://www.chill.colostate.edu/anim/oct2012_gf_pivot/" width=640 height=512> | <imgloop delay=200 imgprefix="http://www.chill.colostate.edu/anim/oct2012_gf_pivot/" width=640 height=512> | ||
| Line 28: | Line 29: | ||
==Differential reflectivity loop== | ==Differential reflectivity loop== | ||
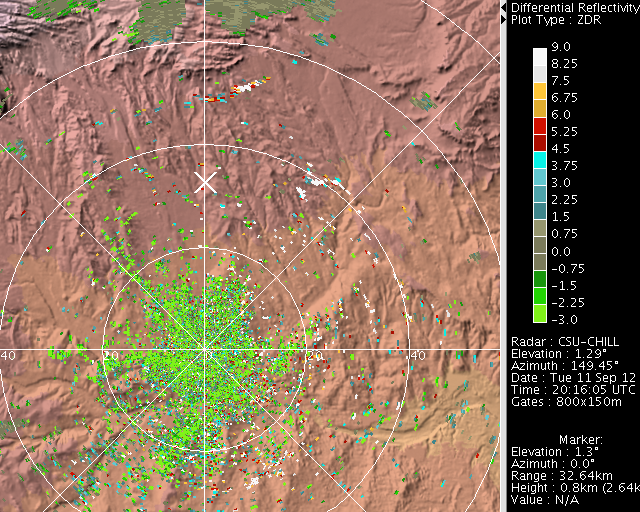
Differential reflectivity levels were very high (+7 to +9 dB) in the boundary layer echo line. These values are significantly more positive than the ~ +3 - +4 dB magnitudes generated by large raindrops. The distinctly flattened cross-sectional shapes presented by flying insects are responsible for the extremely positive Zdr values observed in the echo line. | |||
<center> | <center> | ||
<imgloop delay=200 imgprefix="http://www.chill.colostate.edu/anim/oct2012_gf_pivot/" width=640 height=512> | <imgloop delay=200 imgprefix="http://www.chill.colostate.edu/anim/oct2012_gf_pivot/" width=640 height=512> | ||
Revision as of 15:03, 24 September 2012
Introduction
A series of low elevation angle PPI scans was conducted during the afternoon of 11 September 2012 as a synoptic scale trough approached the area from the west. A boundary layer echo line was located ~50 km north of CSU-CHILL at the start of the observations; this fine was moving towards the south. An area of rain showers subsequently developed ~60 km northeast of the radar. Low level outflow from these showers caused a large portion of the boundary layer echo line to change orientation by ~90 degrees.
Reflectivity loop
The following image sequence was made from a series of PPI scans at an elevation angle of 1.0 deg. The echo line of interest initially had a west-southwest - east-northeast orientation. Locally-enhanced outflow from the rain showers located approximately 60 km to the northeast of the radar rotated the echo line into a northwest - southeast orientation. The white "X" ~35 km north of the radar marks the approximate pivot point for this rotation. Additional, patchy echo areas are also visible moving towards the northeast in the pre-trough synoptic flow.
|
|
||
|
Differential reflectivity loop
Differential reflectivity levels were very high (+7 to +9 dB) in the boundary layer echo line. These values are significantly more positive than the ~ +3 - +4 dB magnitudes generated by large raindrops. The distinctly flattened cross-sectional shapes presented by flying insects are responsible for the extremely positive Zdr values observed in the echo line.
|
|
||
|
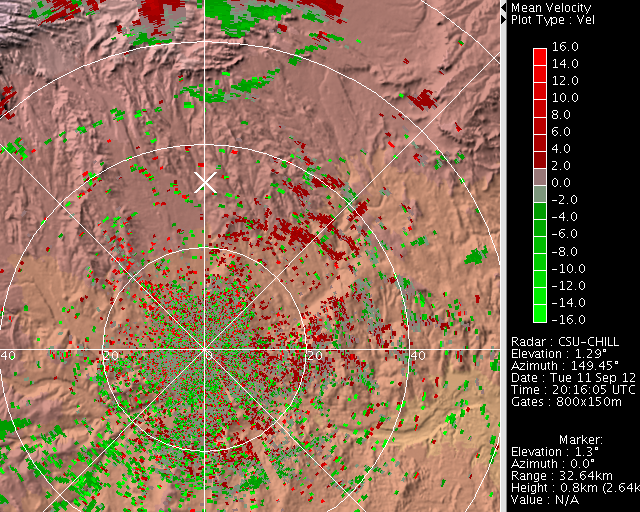
Radial velocity loop
|
|
||
|
RHI images


