Time variations in bright band height: 12 April 2013: Difference between revisions
Pat kennedy (talk | contribs) No edit summary |
Pat kennedy (talk | contribs) No edit summary |
||
| Line 1: | Line 1: | ||
[[Image:12apr2013 311az showers z anot.png|300px|right]] | |||
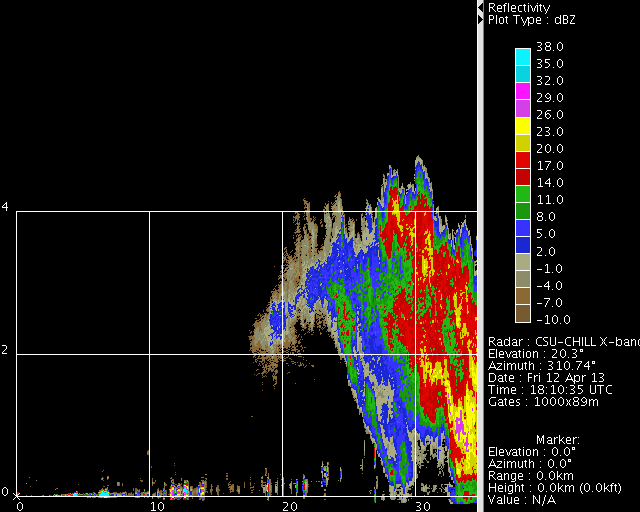
CSU-CHILL X-Band (9 GHz) reflectivity data collected as an area of rain showers approached the radar on 12 April 2013. RHI scans were repeated at ~47 second intervals on an azimuth of 311 degrees to obtain high time resolution observations of the reflectivity and differential reflectivity structures. | |||
==Introduction== | ==Introduction== | ||
Around mid-day on 12 April 2013, a line of weak rain | Around mid-day on 12 April 2013, a line of weak showers that primarily produced rain at the surface approached the CSU-CHILL radar site from the northwest. The radar was operating in X-band only configuration on this date. To obtain high time resolution data, a sequence of two-sweep RHI scans (up on azimuth 308 deg and down on 311 deg) was established through the echo area that appeared to be tracking directly towards the radar. This scan sequence gave a time interval of ~46 seconds between sweeps. | ||
==Reflectivity loop== | ==Reflectivity loop== | ||
| Line 39: | Line 45: | ||
==Differential reflectivity loop== | ==Differential reflectivity loop== | ||
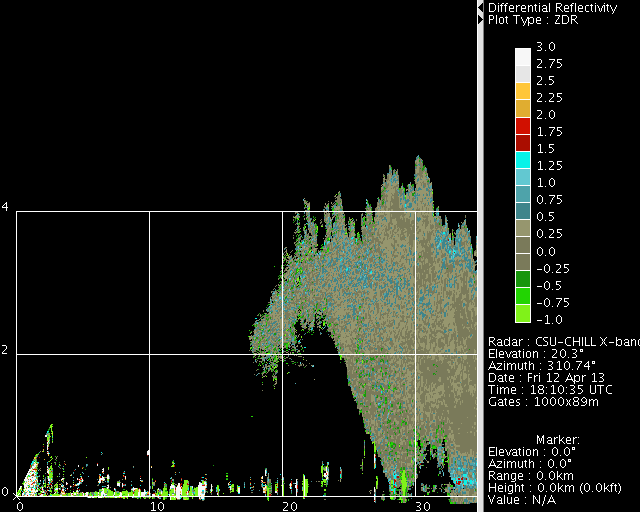
Zdr's were often positive where pristine crystals predominated near the echo top. Zdr values near 0 dB were typically observed in the strongest echo regions where many irregularly-shaped aggregates existed. A layer of enhanced positive Zdr values was was located just below the 0 deg C level where melting ice particles were transitioning into relatively large, oblate raindrops. The melting process takes longer for larger, more massive ice particles. The | Zdr's were often positive where pristine crystals predominated near the echo top. Zdr values near 0 dB were typically observed in the strongest echo regions where many irregularly-shaped aggregates existed. A layer of enhanced positive Zdr values was was located just below the 0 deg C level where melting ice particles were transitioning into relatively large, oblate raindrops. The melting process takes longer for larger, more massive ice particles; melting also locally cools the environment (Stewart and King, 1987 MWR, p1894-1907). The combination of these effects briefly lowered and disrupted the bright band layer near the 17 km range point around frame 20 (1825:19 UTC) as a higher reflectivity "streamer" descended through the 0 deg C level. | ||
<center> | <center> | ||
<imgloop delay=200 imgprefix="http://www.chill.colostate.edu/anim/14apr2013_bb_bounce/" width=640 height=512> | <imgloop delay=200 imgprefix="http://www.chill.colostate.edu/anim/14apr2013_bb_bounce/" width=640 height=512> | ||
| Line 77: | Line 83: | ||
[[Image:12apr2013 XB zdr ovly 2 anot.png|center]] | [[Image:12apr2013 XB zdr ovly 2 anot.png|center]] | ||
==Summary== | |||
High time resolution RHI observations documented rapid variations in the Zdr-indicated appearance of the melting level in an area of early spring showers that produced both rain and wet snow at the surface. | |||
[[Category:Featured Articles]] | [[Category:Featured Articles]] | ||
[[Category:Bright Band]] | [[Category:Bright Band]] | ||
Latest revision as of 10:04, 31 May 2013

CSU-CHILL X-Band (9 GHz) reflectivity data collected as an area of rain showers approached the radar on 12 April 2013. RHI scans were repeated at ~47 second intervals on an azimuth of 311 degrees to obtain high time resolution observations of the reflectivity and differential reflectivity structures.
Introduction
Around mid-day on 12 April 2013, a line of weak showers that primarily produced rain at the surface approached the CSU-CHILL radar site from the northwest. The radar was operating in X-band only configuration on this date. To obtain high time resolution data, a sequence of two-sweep RHI scans (up on azimuth 308 deg and down on 311 deg) was established through the echo area that appeared to be tracking directly towards the radar. This scan sequence gave a time interval of ~46 seconds between sweeps.
Reflectivity loop
The following image sequence was assembled from the 311 degree azimuth RHI sweeps between 1810:13 and 1831:08 UTC. Due to the stronger upper level wind speeds, the evolution of the echo pattern indicates that ice particles were advected out ahead of the main shower area. Local reflectivity increases developed as these particles descended through the 0 deg C level (~900 m AGL on the 00 UTC DNR sounding) ahead of the strongest echoes.
|
|
||
|
Differential reflectivity loop
Zdr's were often positive where pristine crystals predominated near the echo top. Zdr values near 0 dB were typically observed in the strongest echo regions where many irregularly-shaped aggregates existed. A layer of enhanced positive Zdr values was was located just below the 0 deg C level where melting ice particles were transitioning into relatively large, oblate raindrops. The melting process takes longer for larger, more massive ice particles; melting also locally cools the environment (Stewart and King, 1987 MWR, p1894-1907). The combination of these effects briefly lowered and disrupted the bright band layer near the 17 km range point around frame 20 (1825:19 UTC) as a higher reflectivity "streamer" descended through the 0 deg C level.
|
|
||
|
Combined reflectivity and differential reflectivity data
The following overlay plot shows an expanded view of the lowest height levels in the final frame of the animation sequence when appreciable variations existed in the height of the Zdr bright band. The white +0.7 dB Zdr contour generally encloses the region where melting enhancement was taking place. The solid black line is a subjective indication of the center of the melting layer. To a first approximation, the Zdr indications of melting particles were lowered in the higher reflectivity areas where larger, slower melting particles were likely to exist. (Reflectivity maxima at the lowest height are ground clutter returns.)

Summary
High time resolution RHI observations documented rapid variations in the Zdr-indicated appearance of the melting level in an area of early spring showers that produced both rain and wet snow at the surface.