Thundersnow: 14 November 2009: Difference between revisions
Pat kennedy (talk | contribs) (overview added) |
m (Fixed reference) |
||
| (One intermediate revision by the same user not shown) | |||
| Line 1: | Line 1: | ||
[[Image:14nov2009 VCHILL z TSNOW anot 2.png|300px|right]] | |||
[[Image:14nov2009 VCHILL z TSNOW anot 2.png|300px| | |||
CSU-CHILL reflectivity data in a low elevation PPI sweep through a convective snowband near Denver International Airport (KDEN) on 14 November 2009. Thundersnow was reported in the KDEN surface observations. Several plots of Doppler and dual-polarization data have been prepared. | CSU-CHILL reflectivity data in a low elevation PPI sweep through a convective snowband near Denver International Airport (KDEN) on 14 November 2009. Thundersnow was reported in the KDEN surface observations. Several plots of Doppler and dual-polarization data have been prepared. | ||
==Introduction== | ==Introduction== | ||
During the late afternoon hours of 13 November 2009 (local date), snow showers developed over the foothills of the Rocky Mountains and organized into a linear echo formation as they approached Denver International Airport (KDEN). Based on the KDEN surface weather observations (METARS), a combination of thunderstorm activity and snow (-TSSN) was reported during two time periods: 2333 - 2350 and 0011 - 0026 UTC. | During the late afternoon hours of 13 November 2009 (local date), snow showers developed over the foothills of the Rocky Mountains and organized into a linear echo formation as they approached Denver International Airport (KDEN). Based on the KDEN surface weather observations (METARS), a combination of thunderstorm activity and snow (-TSSN) was reported during two time periods: 2333 - 2350 and 0011 - 0026 UTC. The KDEN surface temperature remained at 0 degrees C throughout this period. Example radar data plots from the second period of lightning activity are shown below. | ||
==0.5 degree elevation angle PPI data at 0013 UTC== | ==0.5 degree elevation angle PPI data at 0013 UTC== | ||
The following 4 panel plot generated with the NCAR SOLO program presents the low level echo situation at 0013 UTC. The axis of the echo line was located just north of KDEN at this time (upper left panel). The irregular boundaries marked in all of the panels highlight several areas of reduced | The following 4 panel plot generated with the NCAR SOLO program presents the low level echo situation at 0013 UTC. The axis of the echo line was located just north of KDEN at this time (upper left panel). The irregular boundaries marked in all of the panels highlight several areas of reduced <math>\rho_{HV}</math> (lower left panel) correlation levels. These same areas also had enhanced Ldr levels (lower right panel). These smaller-scale features were less evident in the differential reflectivity field (upper left), where positive <math>Z_{dr}</math> values were present along much of the leading edge of the echo line. The reduced <math>\rho_{HV}</math> and enhanced Ldr values in the echo core regions indicate that localized convective cells were probably introducing irregularly shaped, gyrating graupel particles into the more widespread snow echo. (According to the METAR remarks, both in-cloud and cloud to ground lightning were observed to the north of KDEN). | ||
[[Image:14nov2009 0013UTC 0.5deg solo PPI anot.png|center]] | [[Image:14nov2009 0013UTC 0.5deg solo PPI anot.png|center]] | ||
| Line 13: | Line 12: | ||
==Dual Doppler Earth-relative horizontal wind field at 3.5 km MSL== | ==Dual Doppler Earth-relative horizontal wind field at 3.5 km MSL== | ||
Both the CSU-CHILL and KFTG WSR-88D radar began volume scans within 20 seconds of 0018 UTC. The radial velocities observed by these two radars were used to synthesize the horizontal wind field; the resultant flow field at the 3.5 km MSL CAPPI level is shown below. | Both the CSU-CHILL and KFTG WSR-88D radar began volume scans within 20 seconds of 0018 UTC. The radial velocities observed by these two radars were used to synthesize the horizontal wind field; the resultant flow field at the 3.5 km MSL CAPPI level is shown below. The CSU-CHILL radar is the analysis grid origin. Convergent flow is evident along the leading edge of the echo band. This convergence probably aided in the initiation and maintenance of convective updrafts and the associated cloud electrification processes. The strongest line-normal flow within the echo band generally occurred in the trailing half of the echo system. | ||
[[Image:14nov2009 0018UTC 3.5km MSL ddop anot.png|center]] | [[Image:14nov2009 0018UTC 3.5km MSL ddop anot.png|center]] | ||
| Line 19: | Line 18: | ||
==125 degree azimuth RHI data== | ==125 degree azimuth RHI data== | ||
A series of RHI scans were conducted at several azimuths that intersected the echo line. The reflectivity and radial velocity fields in the 125 degree azimuth RHI plane display vertically-contiguous echo core structures and a mid-level rear inflow pattern that appeared to be aiding horizontal convergence and upward motions in the leading portions of the line. | A series of RHI scans were conducted at several azimuths that intersected the echo line. The reflectivity and radial velocity fields in the 125 degree azimuth RHI plane display vertically-contiguous echo core structures and a mid-level rear inflow pattern that appeared to be aiding horizontal convergence and upward motions in the leading portions of the line. | ||
[[Image:14nov2009 125az RHI z v.png.png|center]] | [[Image:14nov2009 125az RHI z v.png.png|center]] | ||
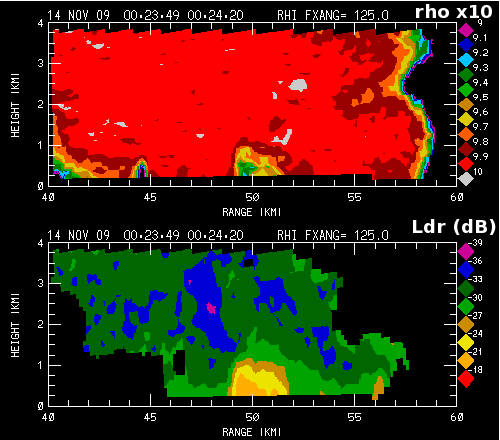
The following two plots show an expanded view of the base of the convective core at the 50 km range point. The reduction in | The following two plots show an expanded view of the base of the convective core at the 50 km range point. The reduction in <math>\rho_{HV}</math> and the enhancement in Ldr in the lowest ~1 km layer are apparent. Such patterns are suggestive of melting effects, but the 00 UTC DNR (Denver) radiosonde data did not detect any above-freezing temperatures aloft. The KDEN surface observations also reported fog; it is possible that the wetness of the outer surface of the graupel particles in the convective precipitation cores was increased through the accretion of fog droplets. In any event, polarimetric radar data have demonstrated utility in identifying mesoscale variations in cold season precipitation (Schuur et al, JAMC 2011 in press) | ||
[[Image:14nov2009 125az RHI rho ldr.png|center]] | [[Image:14nov2009 125az RHI rho ldr.png|center]] | ||
==References== | |||
* Schuur, Terry J., Hyang-Suk Park, Alexander V. Ryzhkov, Heather D. Reeves, 2011: [http://dx.doi.org/10.1175/JAMC-D-11-091.1 Classification of precipitation types during transitional winter weather using the RUC model and polarimetric radar retrievals]. ''J. Appl. Meteorology and Climatology.'', '''51''', ''763–779''. | |||
[[Category:Winter Storm]] | |||
[[Category:Thundersnow]] | |||
[[Category:Featured Articles]] | |||
Latest revision as of 14:37, 5 December 2012
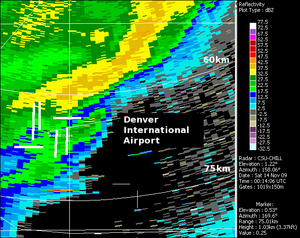
CSU-CHILL reflectivity data in a low elevation PPI sweep through a convective snowband near Denver International Airport (KDEN) on 14 November 2009. Thundersnow was reported in the KDEN surface observations. Several plots of Doppler and dual-polarization data have been prepared.
Introduction
During the late afternoon hours of 13 November 2009 (local date), snow showers developed over the foothills of the Rocky Mountains and organized into a linear echo formation as they approached Denver International Airport (KDEN). Based on the KDEN surface weather observations (METARS), a combination of thunderstorm activity and snow (-TSSN) was reported during two time periods: 2333 - 2350 and 0011 - 0026 UTC. The KDEN surface temperature remained at 0 degrees C throughout this period. Example radar data plots from the second period of lightning activity are shown below.
0.5 degree elevation angle PPI data at 0013 UTC
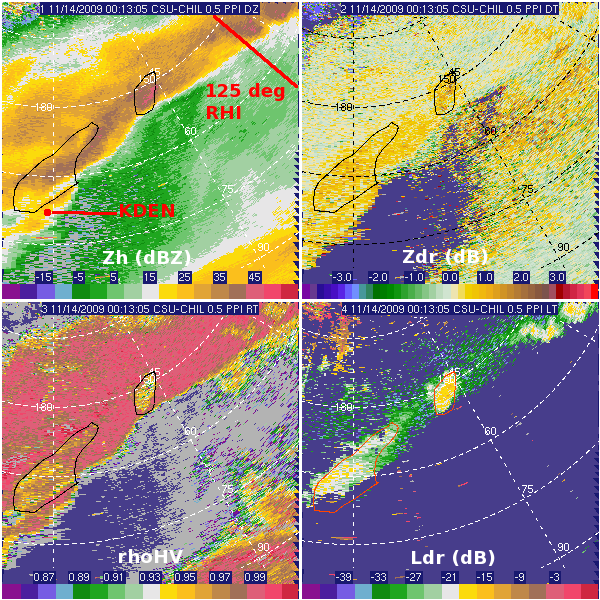
The following 4 panel plot generated with the NCAR SOLO program presents the low level echo situation at 0013 UTC. The axis of the echo line was located just north of KDEN at this time (upper left panel). The irregular boundaries marked in all of the panels highlight several areas of reduced (lower left panel) correlation levels. These same areas also had enhanced Ldr levels (lower right panel). These smaller-scale features were less evident in the differential reflectivity field (upper left), where positive values were present along much of the leading edge of the echo line. The reduced and enhanced Ldr values in the echo core regions indicate that localized convective cells were probably introducing irregularly shaped, gyrating graupel particles into the more widespread snow echo. (According to the METAR remarks, both in-cloud and cloud to ground lightning were observed to the north of KDEN).
Dual Doppler Earth-relative horizontal wind field at 3.5 km MSL
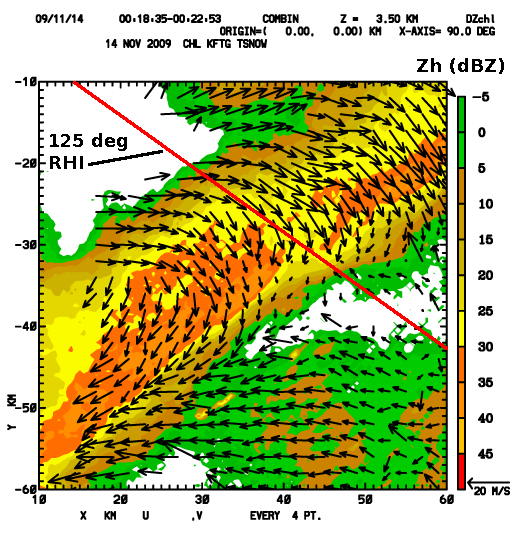
Both the CSU-CHILL and KFTG WSR-88D radar began volume scans within 20 seconds of 0018 UTC. The radial velocities observed by these two radars were used to synthesize the horizontal wind field; the resultant flow field at the 3.5 km MSL CAPPI level is shown below. The CSU-CHILL radar is the analysis grid origin. Convergent flow is evident along the leading edge of the echo band. This convergence probably aided in the initiation and maintenance of convective updrafts and the associated cloud electrification processes. The strongest line-normal flow within the echo band generally occurred in the trailing half of the echo system.
125 degree azimuth RHI data
A series of RHI scans were conducted at several azimuths that intersected the echo line. The reflectivity and radial velocity fields in the 125 degree azimuth RHI plane display vertically-contiguous echo core structures and a mid-level rear inflow pattern that appeared to be aiding horizontal convergence and upward motions in the leading portions of the line.
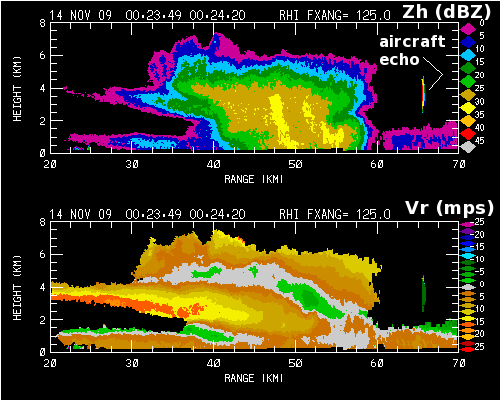
The following two plots show an expanded view of the base of the convective core at the 50 km range point. The reduction in and the enhancement in Ldr in the lowest ~1 km layer are apparent. Such patterns are suggestive of melting effects, but the 00 UTC DNR (Denver) radiosonde data did not detect any above-freezing temperatures aloft. The KDEN surface observations also reported fog; it is possible that the wetness of the outer surface of the graupel particles in the convective precipitation cores was increased through the accretion of fog droplets. In any event, polarimetric radar data have demonstrated utility in identifying mesoscale variations in cold season precipitation (Schuur et al, JAMC 2011 in press)
References
- Schuur, Terry J., Hyang-Suk Park, Alexander V. Ryzhkov, Heather D. Reeves, 2011: Classification of precipitation types during transitional winter weather using the RUC model and polarimetric radar retrievals. J. Appl. Meteorology and Climatology., 51, 763–779.

