Template:Featured Image/December, 2012: Difference between revisions
From CSU-CHILL
(Duplicated last month's image) |
Pat kennedy (talk | contribs) (initial posting) |
||
| Line 1: | Line 1: | ||
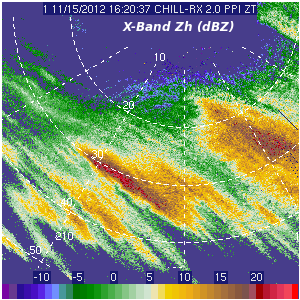
{{POTM|image= | {{POTM|image=15nov2012 0.2deg index xb ZT.png|200px|title=X-Band data indexed at 0.2 deg azimuth intervals|credit=Pat Kennedy|text=Banded echo features observed in a non-precipitating mid-level cloud layer during tests of beam indexing in the CSU-CHILL X-Band system. Signal processor outputs at 0.2 deg azimuth intervals improve the resolution of the fine scale reflectivity patterns.}} | ||
Revision as of 15:05, 3 December 2012

|
X-Band data indexed at 0.2 deg azimuth intervals Banded echo features observed in a non-precipitating mid-level cloud layer during tests of beam indexing in the CSU-CHILL X-Band system. Signal processor outputs at 0.2 deg azimuth intervals improve the resolution of the fine scale reflectivity patterns. Photo credit: Pat Kennedy |