Radial velocity indication of shifting wind direction: 27 July 2009: Difference between revisions
Pat kennedy (talk | contribs) (initial loop frame development for article.) |
Pat kennedy (talk | contribs) (initial posting) |
||
| Line 1: | Line 1: | ||
==Introduction== | |||
Thunderstorm areas often generate meso-scale perturbations in the surface pressure and wind fields (Johnson, 2001 BAMS). During the afternoon hours of 27 July 2009, the radial velocity patterns observed by the CSU-CHILL radar exhibited a systematic shift in the near-surface wind direction due to the passage of a band of rain showers and thunderstorms. | |||
==Pre-storm observations== | |||
At 2055:39 UTC an echo band oriented along a southwest - northeast axis was nearing the radar site: | |||
[[Image:27jul2009 intro ZT.png|center]] | |||
The associated radial velocity pattern is shown below. The orientation of the zero velocity line at the radar indicated that near-surface winds were approaching from the northwest. The presence of stronger inbound flow was indicted by the region of dark blue colors located ~15 km northwest of the radar in the leading edge of the convective precipitation band. | |||
[[Image:27jul2009 intro VT.png|center]] | |||
<hr> | |||
==Time lapse images== | |||
Between 2055 and 2149 UTC, the precipitation band passed the radar site. (An accumulation of 0.73 inches of rain was measured at the radar in association with this band passage.) The following loop shows data from 2 degree PPI sweeps that were made at ~3 minute intervals between 2149 and 2208 UTC. The steady rotation of the wind direction from a southwest to a southeast direction that took place over this ~20 minute time period is evident. (The red arrow overlay indicates the approximate surface wind direction at each time step). In the second half of the sequence, a convergence feature associated with a fine line echo moves into the western portion of the display: | |||
<center> | <center> | ||
<imgloop delay=400 imgprefix="http://www.chill.colostate.edu/anim/27jul2009_vr_rotate/" width=400 height=384> | <imgloop delay=400 imgprefix="http://www.chill.colostate.edu/anim/27jul2009_vr_rotate/" width=400 height=384> | ||
| Line 13: | Line 24: | ||
</center> | </center> | ||
<hr> | <hr> | ||
The reflectivity data from this same time period is shown below. Reduced echo strength is apparent near the zero velocity line due to the effects of the clutter filter that was in use in the digital signal processor: | |||
<center> | <center> | ||
<imgloop delay=400 imgprefix="http://www.chill.colostate.edu/anim/27jul2009_vr_rotate/" width=400 height=384> | <imgloop delay=400 imgprefix="http://www.chill.colostate.edu/anim/27jul2009_vr_rotate/" width=400 height=384> | ||
| Line 26: | Line 37: | ||
</center> | </center> | ||
<hr> | <hr> | ||
The surface wind flow at Greeley underwent considerable variation during the afternoon of 27 July 2009. Observations made by Doppler weather radars can provide an effective means of remotely sensing these localized wind field variations. | |||
Revision as of 11:41, 24 May 2010
Introduction
Thunderstorm areas often generate meso-scale perturbations in the surface pressure and wind fields (Johnson, 2001 BAMS). During the afternoon hours of 27 July 2009, the radial velocity patterns observed by the CSU-CHILL radar exhibited a systematic shift in the near-surface wind direction due to the passage of a band of rain showers and thunderstorms.
Pre-storm observations
At 2055:39 UTC an echo band oriented along a southwest - northeast axis was nearing the radar site:

The associated radial velocity pattern is shown below. The orientation of the zero velocity line at the radar indicated that near-surface winds were approaching from the northwest. The presence of stronger inbound flow was indicted by the region of dark blue colors located ~15 km northwest of the radar in the leading edge of the convective precipitation band.

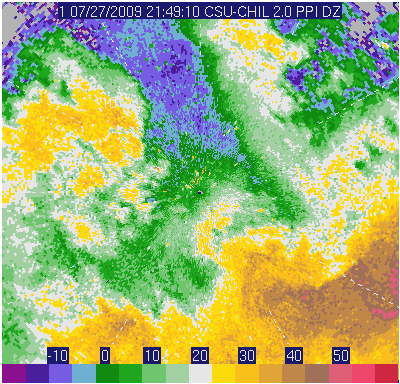
Time lapse images
Between 2055 and 2149 UTC, the precipitation band passed the radar site. (An accumulation of 0.73 inches of rain was measured at the radar in association with this band passage.) The following loop shows data from 2 degree PPI sweeps that were made at ~3 minute intervals between 2149 and 2208 UTC. The steady rotation of the wind direction from a southwest to a southeast direction that took place over this ~20 minute time period is evident. (The red arrow overlay indicates the approximate surface wind direction at each time step). In the second half of the sequence, a convergence feature associated with a fine line echo moves into the western portion of the display:
|
|
||
|
The reflectivity data from this same time period is shown below. Reduced echo strength is apparent near the zero velocity line due to the effects of the clutter filter that was in use in the digital signal processor:
|
|
||
|
The surface wind flow at Greeley underwent considerable variation during the afternoon of 27 July 2009. Observations made by Doppler weather radars can provide an effective means of remotely sensing these localized wind field variations.