Melting Z enhancement 28mar2018
Overview
The CSU-CHILL radar was conducting a series of system test operations during the mid-day hours of 28 March 2018. Continuous two sweep RHI scans were done on azimuths of 160 and XXX degrees as a part of these tests. These azimuths were selected due to their alignment with the narrow band of light showers that was passing the CHILL site. Surface temperatures at the radar were a few degrees above freezing during this period; the precipitation at the surface was observed to be light rain. This precipitation developed several hours after the passage of a surface cold front. Cold air advection was present in the NWS 500 HPA analyses valid at 12 UTC on the morning of 28 March. The sounding data from Denver (located ~80 km to the south of CSU-CHILL) showed that the environmental freezing level fell from ~1100 m AGL ahead of the cold front at 12 UTC to ~270 m at 00 UTC on the 29th. (These heights are reference to the CHILL radar elevation.) The following low level (0.5 degree elevation angle) PPI scan done by the NWS KFTG radar at 19XX UTC shows the general echo distribution:
Image
S-band reflectivity loop from the 160 degree RHI sweeps
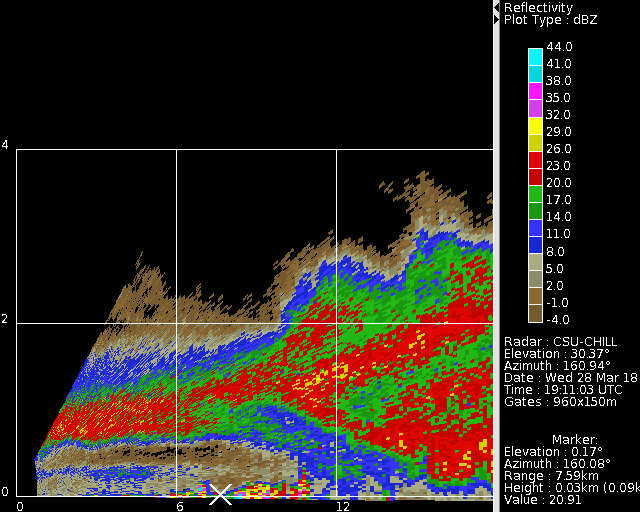
The following loop was assembled from the 160 degree RHI sweeps that were done between 1910 and 1935 UTC. (By the time of the image captures, the azimuth shown in the annotation block had shifted from actual 160 degree data collection angle.) The time interval between the sweeps is 2:07. The primary feature of interest is the general descent of a quasi-horizontal layer with reflectivity levels reaching ~YY dBZ. These reflectivities increased to ~30 dBZ as the descending echo layer reached the 0 C level. By the final loop frames, the narrow echo band was apparently moving out of the RHI scan plane.
|
|
||
|
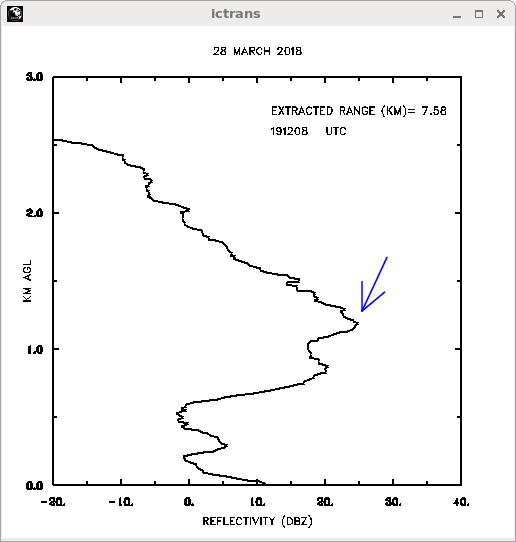
Reflectivity data from the 7.58 km range gate
A more detailed view of the reflectivity evolution in the RHI scans was developed by extracting the reflectivity data in the 7.58 km range gate in each sweep. It should be noted that this selection of a single range gate means that the plots are not vertical profiles. (i.e. The horizontal projection of the sample volume approaches the radar as the elevation angle increases. The white cursor cross in the preceding RHI loop frames marks the 7.58 km range point at the surface.) Due to the quasi-horizontal echo layering in the RHI scans, this simple single range gate extraction is capable of capturing the general evolution pattern.
|
|
||
|
DNR 0C heights:
12 UTC on 3/28=1112 m AGL at CHILL
00 UTC on 3/29=267 m AGL at CHILL
