Initial dual frequency observations of rain: 17 July 2012: Difference between revisions
Pat kennedy (talk | contribs) No edit summary |
Pat kennedy (talk | contribs) No edit summary |
||
| Line 14: | Line 14: | ||
==Reflectivity== | ==Reflectivity== | ||
Reflectivity data obtained at the two wavelengths (11 cm / S-Band and 3 cm / X-Band) in an RHI scan are shown below. The gate spacings at these two wavelengths are 150 and 75 m respectively. Due to the slow scan rate (1 deg / sec), the observations were oversampled with respect to the antenna beamwidths (~1.0 deg at S-Band and 0.33 deg at X-Band). The beam intervals in the data were ~.09 deg at S-Band and ~-06 deg at X-Band. The combination of these factors gives a higher resolution, smoother image of the echo structures in the X-Band data. Reflectivity enhancement due to the onset of hydrometeor melting is apparent near the 3 km AGL level. No attenuation corrections have been applied to the X-Band data; the X-Band reflectivity levels generally decrease with respect to the S-Band values along beams that penetrate stronger echo regions. | Reflectivity data obtained at the two wavelengths (11 cm / S-Band and 3 cm / X-Band) in an RHI scan are shown below. The gate spacings at these two wavelengths are 150 and 75 m respectively. Due to the slow scan rate (1 deg / sec), the observations were oversampled with respect to the antenna beamwidths (~1.0 deg at S-Band and 0.33 deg at X-Band). The beam intervals in the recorded data were ~.09 deg at S-Band and ~-06 deg at X-Band. The combination of these factors gives a higher resolution, smoother image of the echo structures in the X-Band data. Reflectivity enhancement due to the onset of hydrometeor melting is apparent near the 3 km AGL level. No attenuation corrections have been applied to the X-Band data; the X-Band reflectivity levels generally decrease with respect to the S-Band values along beams that penetrate stronger echo regions. | ||
[[Image:S Z 17jul2012 anot.png|center]] | [[Image:S Z 17jul2012 anot.png|center]] | ||
| Line 21: | Line 21: | ||
==Differential reflectivity== | ==Differential reflectivity== | ||
The corresponding differential plots are shown below; for reference the 30 and 45 dBZ reflectivity contours have been included. Positive Zdr values are evident at and below the melting level. Differential attenuation induces a negative Zdr bias generally within and down-range of the heavier rain regions (i.e., at and below 3 km AGL). | The corresponding differential reflectivity plots are shown below; for reference the 30 and 45 dBZ reflectivity contours have been included. Positive Zdr values are evident at and below the melting level. Differential attenuation induces a negative Zdr bias generally within and down-range of the heavier rain regions (i.e., at and below 3 km AGL). | ||
[[Image:S Zdr 17jul2012 anot.png|center]] | [[Image:S Zdr 17jul2012 anot.png|center]] | ||
| Line 28: | Line 28: | ||
==Differential propagation phase== | ==Differential propagation phase== | ||
During propagation through oriented hydrometeors, the difference between the H and V received phases is inversely proportional to wavelength. In the following plots, an offset has been applied to the S-Band phase data to bring its starting value (i.e., in the first few km range interval) into agreement with the X-Band data. The same color scale range is then used for both wavelengths. The X-Band phidp accumulation through the oblate drops in the heavy rain area starting near 25 km range is approximately three times larger than the S-Band / 11 cm wavelength phase change. This increased phidp sensitivity at X-Band also improves the ability to detect the small negative phase shifts that result when strong electric fields rotate planar ice crystals into a quasi-vertical alignment. Such a negative phase shift (green changing to blue with increasing range) "electric field" signature near X=33 km, Z=9 km is more clearly evident in the X-Band data. | |||
[[Image:S phi 17jul2012 anot.png|center]] | [[Image:S phi 17jul2012 anot.png|center]] | ||
[[Image:X phi 17jul2012 anot.png|center]] | [[Image:X phi 17jul2012 anot.png|center]] | ||
==Summary== | |||
The dual frequency polarimetric data collected by the CSU-CHILL radar is providing reasonable-looking patterns in convective rain. More detailed data examinations as well as refinements to various attenuation correction procedures for the X-Band measurements are ongoing. | |||
Revision as of 05:54, 30 July 2012
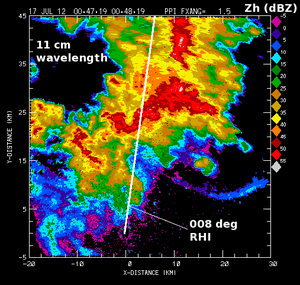
CSU-CHILL reflectivity data collected at 11 cm wavelength in a PPI scan through an area of thunderstorms during dual frequency test operations. Plots of selected dual polarization data fields observed at radar wavelengths of 11 and 3 cm in an RHI scan on the 008 degree azimuth angle have been collected.
Introduction
Following the conclusion of the DC3 project, the dual frequency feedhorn was returned to service on the CSU-CHILL radar on 5 July 2012. Test operations were conducted on several subsequent days in July when rain was in the area. The data shown below was collected when an area of rain with embedded non-severe convection passed north of the radar during the early UTC hours of 17 July 2012. These are "first look" data; no detailed calibration efforts have been applied.
Reflectivity
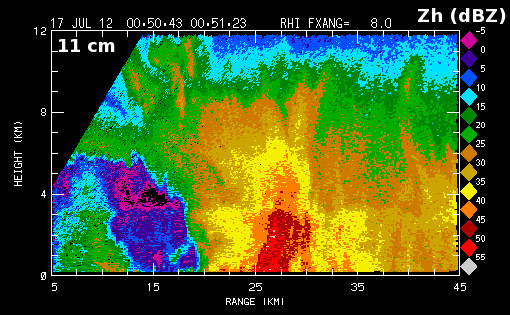
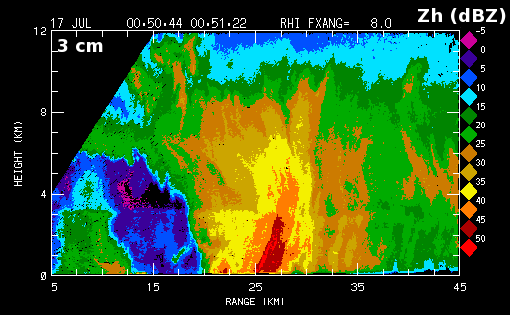
Reflectivity data obtained at the two wavelengths (11 cm / S-Band and 3 cm / X-Band) in an RHI scan are shown below. The gate spacings at these two wavelengths are 150 and 75 m respectively. Due to the slow scan rate (1 deg / sec), the observations were oversampled with respect to the antenna beamwidths (~1.0 deg at S-Band and 0.33 deg at X-Band). The beam intervals in the recorded data were ~.09 deg at S-Band and ~-06 deg at X-Band. The combination of these factors gives a higher resolution, smoother image of the echo structures in the X-Band data. Reflectivity enhancement due to the onset of hydrometeor melting is apparent near the 3 km AGL level. No attenuation corrections have been applied to the X-Band data; the X-Band reflectivity levels generally decrease with respect to the S-Band values along beams that penetrate stronger echo regions.
Differential reflectivity
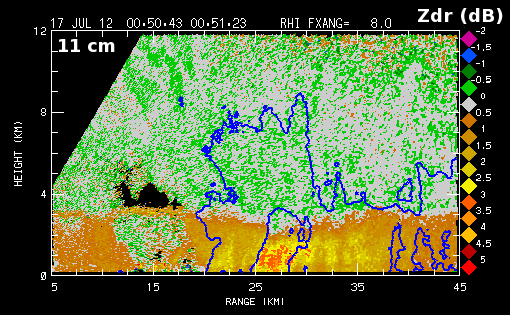
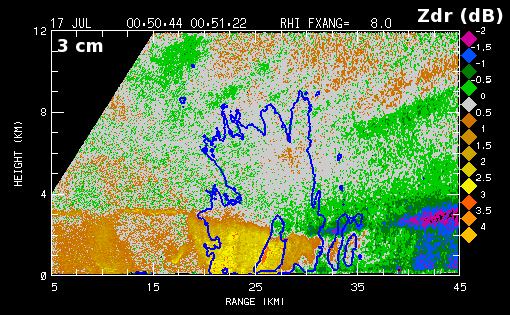
The corresponding differential reflectivity plots are shown below; for reference the 30 and 45 dBZ reflectivity contours have been included. Positive Zdr values are evident at and below the melting level. Differential attenuation induces a negative Zdr bias generally within and down-range of the heavier rain regions (i.e., at and below 3 km AGL).
Differential propagation phase
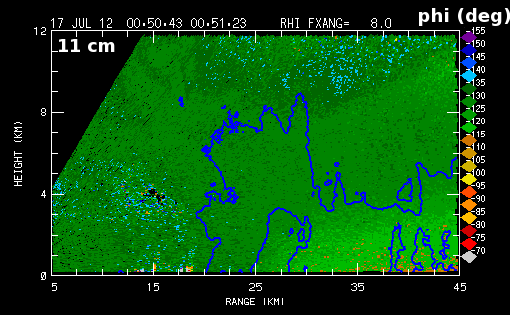
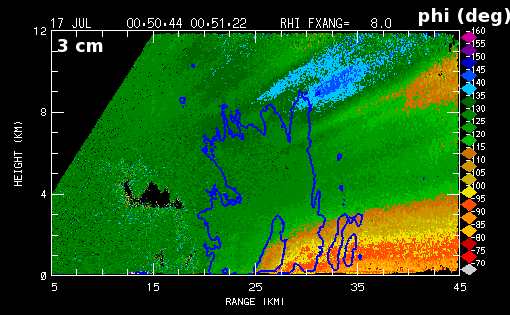
During propagation through oriented hydrometeors, the difference between the H and V received phases is inversely proportional to wavelength. In the following plots, an offset has been applied to the S-Band phase data to bring its starting value (i.e., in the first few km range interval) into agreement with the X-Band data. The same color scale range is then used for both wavelengths. The X-Band phidp accumulation through the oblate drops in the heavy rain area starting near 25 km range is approximately three times larger than the S-Band / 11 cm wavelength phase change. This increased phidp sensitivity at X-Band also improves the ability to detect the small negative phase shifts that result when strong electric fields rotate planar ice crystals into a quasi-vertical alignment. Such a negative phase shift (green changing to blue with increasing range) "electric field" signature near X=33 km, Z=9 km is more clearly evident in the X-Band data.
Summary
The dual frequency polarimetric data collected by the CSU-CHILL radar is providing reasonable-looking patterns in convective rain. More detailed data examinations as well as refinements to various attenuation correction procedures for the X-Band measurements are ongoing.