Hydrometeor classification in an RHI sweep taken with the dual offset feed antenna: Difference between revisions
Pat kennedy (talk | contribs) (New page: ==Introduction== Basic raw data examinations have indicated that the new dual offset feed antenna that was recently installed on the CSU-CHILL radar is operating as designed. (See the sep...) |
(Fixed capitalization on the hydroclass table) |
||
| (10 intermediate revisions by 2 users not shown) | |||
| Line 1: | Line 1: | ||
==Introduction== | ==Introduction== | ||
Basic raw data examinations have indicated that the new dual offset feed antenna that was recently installed on the CSU-CHILL radar is operating as designed. | Basic raw data examinations have indicated that the new dual offset feed antenna that was recently installed on the CSU-CHILL radar is [[First Look Data Collected with the Dual Offset feed Antenna|operating as designed]]. This presentation shows the results of the processing some of the new antenna data with a fuzzy logic based hydrometeor identification system developed at CSU. | ||
==Basic input data== | ==Basic input data== | ||
The basic input data | The basic input data were collected in an RHI scan through an area containing both stratifrom and embedded convective echoes that was observed during the evening hours of 4 June 2008. (5 June on UTC). The unthresholded (raw) input fields are shown below: | ||
<center> | <center> | ||
[[Image:Raw_lh.png]] | {| {{Prettytable}} | ||
|- | |||
|[[Image:Raw_dz.png|300px|Horizontal reflectivity (Zh, dBZ)]] Horizontal reflectivity (Zh, dBZ) | |||
|[[Image:Raw_dr.png|300px|Differential reflectivity (Zdr; dB)]] Differential reflectivity (Zdr; dB) | |||
|- | |||
|[[Image:Raw_dp.png|300px|Differential propagation phase (degrees)]] Differential propagation phase (degrees) | |||
|[[Image:Raw_lh.png|300px|Linear deploarization ratio (Ldr; dB)]] Linear depolarization ratio (Ldr; dB) | |||
|} | |||
</center> | </center> | ||
==Quality controlled input data== | ==Quality controlled input data== | ||
The basic input data were next passed through an objective quality control program that was developed in the CSU Atmospheric Science Department ( | The basic input data were next passed through an objective quality control program that was developed in the CSU Atmospheric Science Department (Cifelli et al., JGR 2002). This program uses the standard deviation of differential propagation phase and a rhoHV threshold to identify and remove non-meteorological data (i.e., ground clutter, etc.) Specific differential propagation is then estimated based upon the objectively-identified "good" data. Selected quality-controlled data fields are shown below: | ||
<center> | <center> | ||
[[Image:Ldc_dz.png]] | {| {{Prettytable}} | ||
|- | |||
|[[Image:Ldc_dz.png|300px|Horizontal reflectivity (Zh, dBZ)]] Horizontal reflectivity (Zh, dBZ) | |||
|[[Image:Ldc_dr.png|300px|Differential reflectivity (Zdr; dB)]] Differential reflectivity (Zdr; dB) | |||
|- | |||
|[[Image:Ldc_kd.png|300px|Differential propagation phase (degrees)]] | |||
Specific differential propagation phase (KDP; degrees/km) | |||
|[[Image:Ldc_lh.png|300px|Linear deploarization ratio (Ldr; dB)]] Linear depolarization ratio (Ldr; dB) | |||
|} | |||
</center> | </center> | ||
==Hydrometeor Classification== | |||
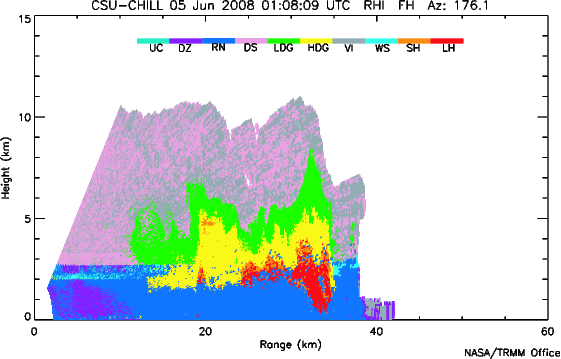
Based on the quality-controlled input data, a fuzzy logic procedure is used to identify the primary type of hydrometeor present at each range gate. The particle identification procedure uses Zh, Zdr, Kdp, rhoHV, and the vertical profile of environmental temperature (In this case obtained from the 00 UTC 5 June 2008 DNR sounding; details of the classification procedure are found in Tessendorf et al., JAS 2005.) The hydrometeors are designated by the code letters shown in the table below the plot. ''(Note: Brenda Dolan, a PhD student in the CSU Atmospheric Science Department, generated these hydrometeor identification results.)'' | |||
<center> | <center> | ||
[[Image: | [[Image:20080605_010809_hidm.png|Hydrometeor classification results]] | ||
</center> | </center> | ||
<center> | <center> | ||
{| {{Prettytable}} | |||
!{{Hl3}} | Letter code<br> | |||
!{{Hl3}} | Hydrometeor type | |||
|- | |||
|UC | |||
|Unclassified | |||
|- | |||
|DZ | |||
|Drizzle | |||
|- | |||
|RN | |||
|Rain | |||
|- | |||
|DS | |||
|Dry Snow | |||
|- | |||
|LDG | |||
|Low Density Graupel | |||
|- | |||
|HDG | |||
|High Density Graupel | |||
|- | |||
|VI | |||
|Vertically Aligned Ice Crystals | |||
|- | |||
|WS | |||
|Wet Snow | |||
|- | |||
|SH | |||
|Small Hail | |||
|- | |||
|LH | |||
|Large Hail | |||
|} | |||
</center> | </center> | ||
[[Category:Featured Articles]] | |||
[[ | |||
Latest revision as of 15:24, 29 July 2008
Introduction
Basic raw data examinations have indicated that the new dual offset feed antenna that was recently installed on the CSU-CHILL radar is operating as designed. This presentation shows the results of the processing some of the new antenna data with a fuzzy logic based hydrometeor identification system developed at CSU.
Basic input data
The basic input data were collected in an RHI scan through an area containing both stratifrom and embedded convective echoes that was observed during the evening hours of 4 June 2008. (5 June on UTC). The unthresholded (raw) input fields are shown below:
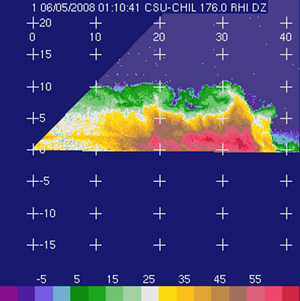 Horizontal reflectivity (Zh, dBZ) Horizontal reflectivity (Zh, dBZ)
|
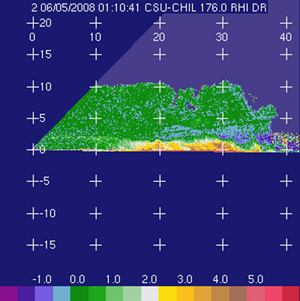 Differential reflectivity (Zdr; dB) Differential reflectivity (Zdr; dB)
|
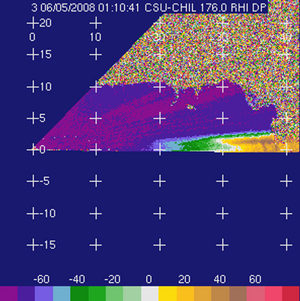 Differential propagation phase (degrees) Differential propagation phase (degrees)
|
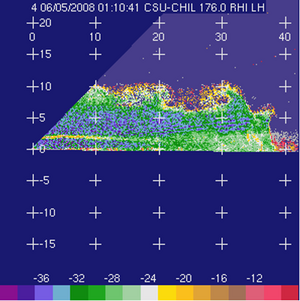 Linear depolarization ratio (Ldr; dB) Linear depolarization ratio (Ldr; dB)
|
Quality controlled input data
The basic input data were next passed through an objective quality control program that was developed in the CSU Atmospheric Science Department (Cifelli et al., JGR 2002). This program uses the standard deviation of differential propagation phase and a rhoHV threshold to identify and remove non-meteorological data (i.e., ground clutter, etc.) Specific differential propagation is then estimated based upon the objectively-identified "good" data. Selected quality-controlled data fields are shown below:
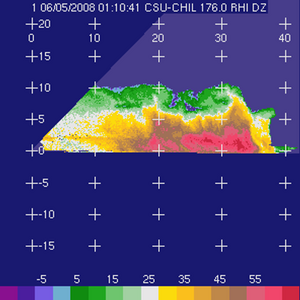 Horizontal reflectivity (Zh, dBZ) Horizontal reflectivity (Zh, dBZ)
|
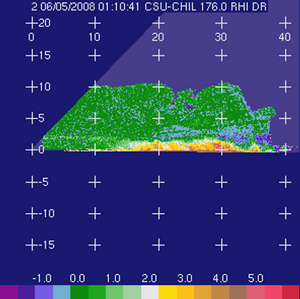 Differential reflectivity (Zdr; dB) Differential reflectivity (Zdr; dB)
|
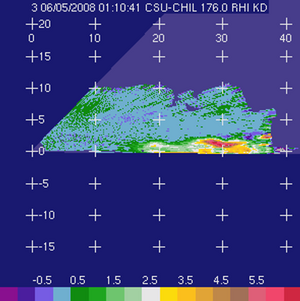
Specific differential propagation phase (KDP; degrees/km) |
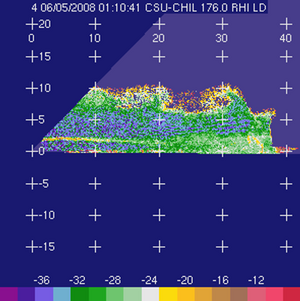 Linear depolarization ratio (Ldr; dB) Linear depolarization ratio (Ldr; dB)
|
Hydrometeor Classification
Based on the quality-controlled input data, a fuzzy logic procedure is used to identify the primary type of hydrometeor present at each range gate. The particle identification procedure uses Zh, Zdr, Kdp, rhoHV, and the vertical profile of environmental temperature (In this case obtained from the 00 UTC 5 June 2008 DNR sounding; details of the classification procedure are found in Tessendorf et al., JAS 2005.) The hydrometeors are designated by the code letters shown in the table below the plot. (Note: Brenda Dolan, a PhD student in the CSU Atmospheric Science Department, generated these hydrometeor identification results.)
| Letter code |
Hydrometeor type |
|---|---|
| UC | Unclassified |
| DZ | Drizzle |
| RN | Rain |
| DS | Dry Snow |
| LDG | Low Density Graupel |
| HDG | High Density Graupel |
| VI | Vertically Aligned Ice Crystals |
| WS | Wet Snow |
| SH | Small Hail |
| LH | Large Hail |
