High time resolution RHI scans through a developing thunderstorm: 30 May 2009: Difference between revisions
Pat kennedy (talk | contribs) (initial posting) |
(Increased loop size to match the source images, added REU link, featured article category) |
||
| Line 1: | Line 1: | ||
==Introduction== | ==Introduction== | ||
REU student Sara Christensen did a project during the summer of 2009 that involved observing the evolution of cumulus cloud echoes using high time resolution RHI scans. During the late afternoon hours of 30 May 2009, an RHI scan was directed towards a visually developing cloud. The scan consisted of two azimuths, with the antenna scanning upward on the first azimuth and downward on the second azimuth. This gave a cycle time of 1:15 on each RHI azimuth. In the following image loops, the RHI sequence along the second azimuth captured the development of precipitation echo aloft and its subsequent descent towards the surface. | [[Educational Outreach#Research_Experience_for_Undergraduates|REU]] student Sara Christensen did a project during the summer of 2009 that involved observing the evolution of cumulus cloud echoes using high time resolution RHI scans. During the late afternoon hours of 30 May 2009, an RHI scan was directed towards a visually developing cloud. The scan consisted of two azimuths, with the antenna scanning upward on the first azimuth and downward on the second azimuth. This gave a cycle time of 1:15 on each RHI azimuth. In the following image loops, the RHI sequence along the second azimuth captured the development of precipitation echo aloft and its subsequent descent towards the surface. | ||
====Reflectivity==== | ====Reflectivity==== | ||
Reflectivity levels exceed 50 dBZ in the developing echo aloft. | Reflectivity levels exceed 50 dBZ in the developing echo aloft. | ||
<center> | <center> | ||
<imgloop delay=400 imgprefix="http://www.chill.colostate.edu/anim/30may2009_RHI/" width= | <imgloop delay=400 imgprefix="http://www.chill.colostate.edu/anim/30may2009_RHI/" width=640 height=512> | ||
z1.png | z1.png | ||
z2.png | z2.png | ||
| Line 26: | Line 26: | ||
Divergent signatures appear near the more distant range portion of the echo (range ~25 km, height ~8 km) around 2356 UTC in association with a new convective bubble. The convergent velocities related to a gust front can be seen moving from right to left beneath the developing precipitation echo. | Divergent signatures appear near the more distant range portion of the echo (range ~25 km, height ~8 km) around 2356 UTC in association with a new convective bubble. The convergent velocities related to a gust front can be seen moving from right to left beneath the developing precipitation echo. | ||
<center> | <center> | ||
<imgloop delay=400 imgprefix="http://www.chill.colostate.edu/anim/30may2009_RHI/" width= | <imgloop delay=400 imgprefix="http://www.chill.colostate.edu/anim/30may2009_RHI/" width=640 height=512> | ||
v1.png | v1.png | ||
v2.png | v2.png | ||
| Line 47: | Line 47: | ||
The expanding precipitation area eventually replaces the highly positive Zdr insect echoes in the boundary layer below the cloud towards the end of the time lapse period. | The expanding precipitation area eventually replaces the highly positive Zdr insect echoes in the boundary layer below the cloud towards the end of the time lapse period. | ||
<center> | <center> | ||
<imgloop delay=400 imgprefix="http://www.chill.colostate.edu/anim/30may2009_RHI/" width= | <imgloop delay=400 imgprefix="http://www.chill.colostate.edu/anim/30may2009_RHI/" width=640 height=512> | ||
zdr1.png | zdr1.png | ||
zdr2.png | zdr2.png | ||
| Line 64: | Line 64: | ||
</imgloop> | </imgloop> | ||
</center> | </center> | ||
[[Category:Featured Articles]] | |||
[[Category:Insects]] | |||
Revision as of 20:39, 8 October 2009
Introduction
REU student Sara Christensen did a project during the summer of 2009 that involved observing the evolution of cumulus cloud echoes using high time resolution RHI scans. During the late afternoon hours of 30 May 2009, an RHI scan was directed towards a visually developing cloud. The scan consisted of two azimuths, with the antenna scanning upward on the first azimuth and downward on the second azimuth. This gave a cycle time of 1:15 on each RHI azimuth. In the following image loops, the RHI sequence along the second azimuth captured the development of precipitation echo aloft and its subsequent descent towards the surface.
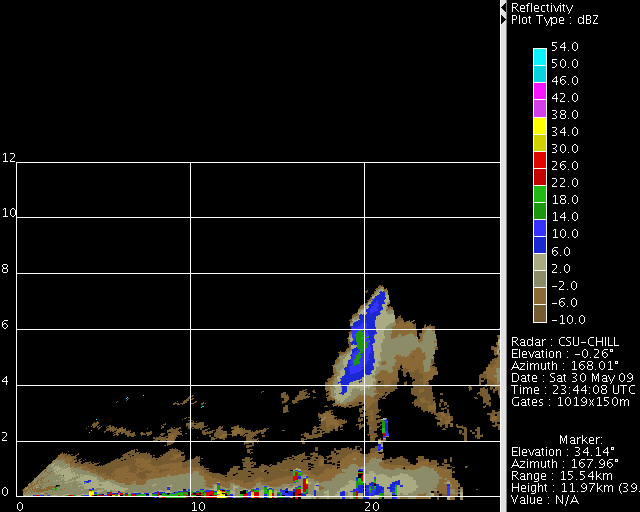
Reflectivity
Reflectivity levels exceed 50 dBZ in the developing echo aloft.
|
|
||
|
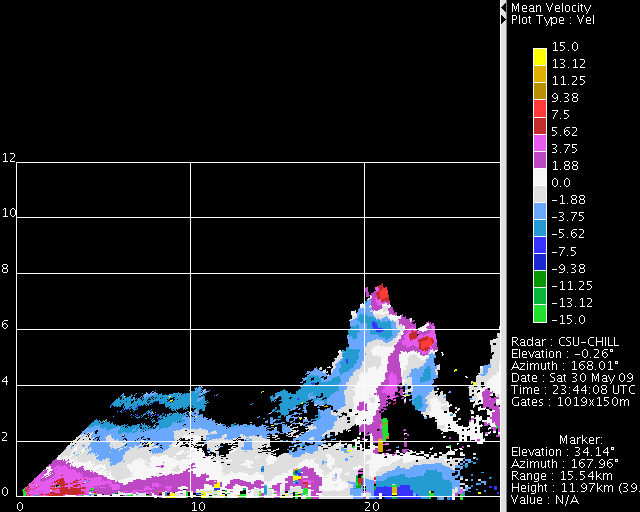
Radial Velocity
Divergent signatures appear near the more distant range portion of the echo (range ~25 km, height ~8 km) around 2356 UTC in association with a new convective bubble. The convergent velocities related to a gust front can be seen moving from right to left beneath the developing precipitation echo.
|
|
||
|
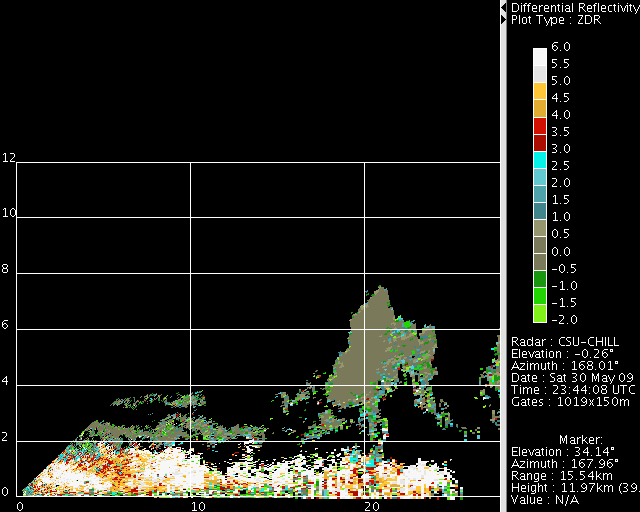
Differential Reflectivity
The expanding precipitation area eventually replaces the highly positive Zdr insect echoes in the boundary layer below the cloud towards the end of the time lapse period.
|
|
||
|