Fine line passage at Denver International Airport: 30 August 2011: Difference between revisions
Pat kennedy (talk | contribs) (initial loop assembly) |
m (Added summary section) |
||
| (5 intermediate revisions by 2 users not shown) | |||
| Line 1: | Line 1: | ||
[[Image:30aug2011 KDEN wshft intro.png|300px|right]] | |||
CSU-CHILL reflectivity data recorded during a fine line passage at Denver International Airport on 30 August 2011. When this boundary passed the ASOS site, a shift in the observed surface wind direction occurred. Time lapse sequences showing the boundary's movement have been prepared. | |||
==Introduction== | |||
During the late afternoon hours of 30 August 2011, a fine line echo was approaching Denver International Airport (KDEN) from the northwest. To obtain high time resolution observations of the boundary's passage at the airport, the CSU-CHILL radar executed a 60 degree wide PPI sector scan composed of two elevation angles (0.5 and 0.9 degrees). This narrow sector gave a volume repeat time of ~28 seconds. The following plot identifies some of the radar base map features. | |||
[[Image:30aug2011 VCHILL base.png]] | |||
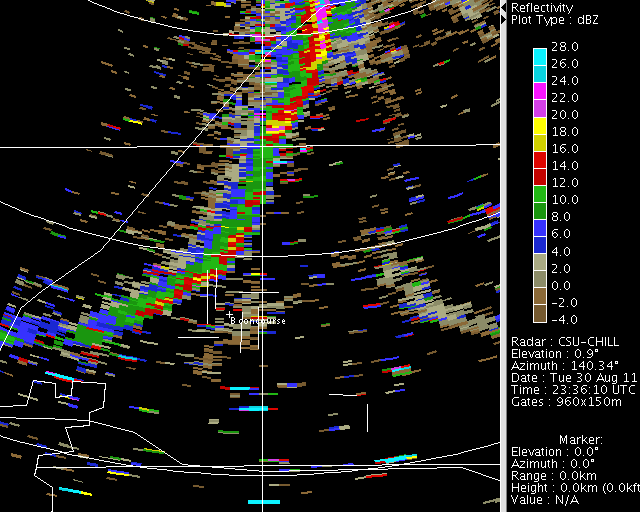
==Reflectivity loop at 0.9 degree elevation angle== | |||
The fine line echo intensity was quite generally at or above 10 dBZ; localized maxima exceeded 18-20 dBZ. The echo extended outside of the horizontal domain used in the following image loop. The overall length was on the order of 100 km. | |||
<center> | <center> | ||
<imgloop delay=200 imgprefix="http://www.chill.colostate.edu/anim/30aug2011_KDEN_fine_line/" width=640 height=512> | <imgloop delay=200 imgprefix="http://www.chill.colostate.edu/anim/30aug2011_KDEN_fine_line/" width=640 height=512> | ||
dBZ.CHL20110830_233547 ppi_pck PPI Sweep 02 Plot 0.png | dBZ.CHL20110830_233547 ppi_pck PPI Sweep 02 Plot 0.png | ||
dBZ.CHL20110830_233615 ppi_pck PPI Sweep 02 Plot 0.png | dBZ.CHL20110830_233615 ppi_pck PPI Sweep 02 Plot 0.png | ||
dBZ.CHL20110830_233644 ppi_pck PPI Sweep 02 Plot 0.png | dBZ.CHL20110830_233644 ppi_pck PPI Sweep 02 Plot 0.png | ||
| Line 37: | Line 46: | ||
</imgloop> | </imgloop> | ||
</center> | </center> | ||
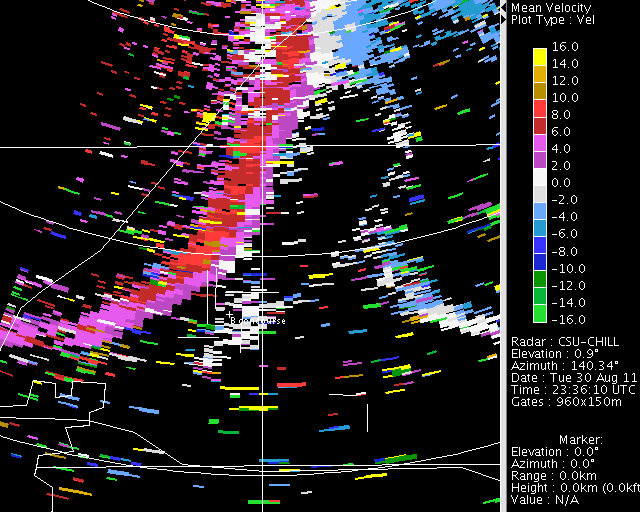
==Radial velocity loop== | |||
Velocities in the vicinity of the airport were low prior to the arrival of the boundary. Velocities became positive (outbound from the radar) along the leading edge of the boundary. | |||
<center> | <center> | ||
<imgloop delay=200 imgprefix="http://www.chill.colostate.edu/anim/30aug2011_KDEN_fine_line/" width=640 height=512> | <imgloop delay=200 imgprefix="http://www.chill.colostate.edu/anim/30aug2011_KDEN_fine_line/" width=640 height=512> | ||
Vel.CHL20110830_233547 ppi_pck PPI Sweep 02 Plot 0.png | Vel.CHL20110830_233547 ppi_pck PPI Sweep 02 Plot 0.png | ||
Vel.CHL20110830_233615 ppi_pck PPI Sweep 02 Plot 0.png | Vel.CHL20110830_233615 ppi_pck PPI Sweep 02 Plot 0.png | ||
Vel.CHL20110830_233644 ppi_pck PPI Sweep 02 Plot 0.png | Vel.CHL20110830_233644 ppi_pck PPI Sweep 02 Plot 0.png | ||
| Line 76: | Line 86: | ||
</imgloop> | </imgloop> | ||
</center> | </center> | ||
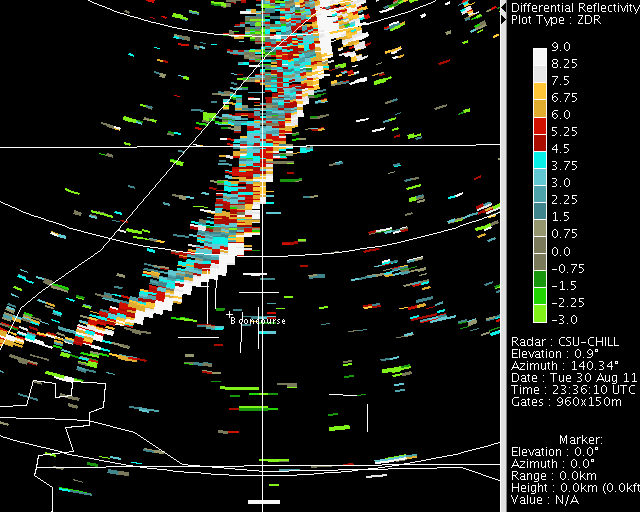
==Differential reflectivity loop== | |||
The fine line was characterized by highly positive Zdr values with many areas reaching 9 dB, the scaling limit used in storing CSU-CHILL Zdr data values. These large positive Zdr values are due to the highly oblate shapes of the insects that were collected by the convergent wind field along the fine line. | |||
<center> | <center> | ||
<imgloop delay=200 imgprefix="http://www.chill.colostate.edu/anim/30aug2011_KDEN_fine_line/" width=640 height=512> | <imgloop delay=200 imgprefix="http://www.chill.colostate.edu/anim/30aug2011_KDEN_fine_line/" width=640 height=512> | ||
ZDR.CHL20110830_233547 ppi_pck PPI Sweep 02 Plot 0.png | ZDR.CHL20110830_233547 ppi_pck PPI Sweep 02 Plot 0.png | ||
ZDR.CHL20110830_233615 ppi_pck PPI Sweep 02 Plot 0.png | ZDR.CHL20110830_233615 ppi_pck PPI Sweep 02 Plot 0.png | ||
ZDR.CHL20110830_233644 ppi_pck PPI Sweep 02 Plot 0.png | ZDR.CHL20110830_233644 ppi_pck PPI Sweep 02 Plot 0.png | ||
| Line 115: | Line 126: | ||
</imgloop> | </imgloop> | ||
</center> | </center> | ||
According the remarks in the KDEN surface weather reports, a wind shift took place at 2347 UTC. The winds had been light and variable before the boundary passage; at 2348 they were from 310 degrees at 18 knots gusting to 25 knots. | |||
[[Image:20110830_kden_asos_obs.png|center]] | |||
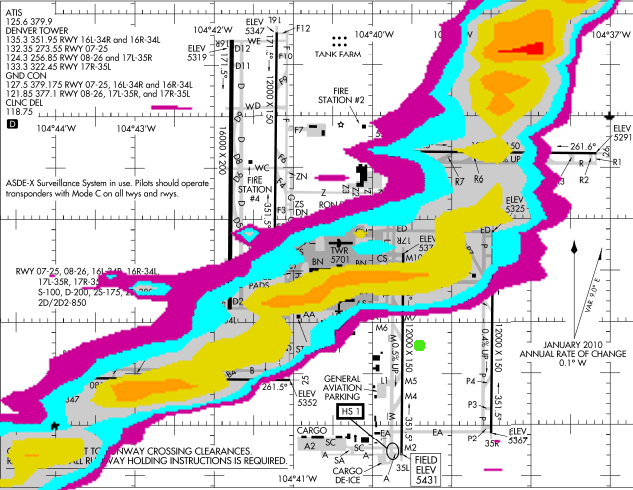
The wind speed and direction were measured by the Automated Surface Observing System (ASOS) which is located at the marked spot on the airport diagram shown below. | |||
[[Image:KDEN 633w anot.png]] | |||
The following series of images shows an expanded view of the reflectivity field as the fine line as it reached the ASOS site. The contours start at 9 dBZ and increase in 3 dB steps. Due to the two minute running average used in the ASOS wind measuring system, the fine line echo reaches the instrumentation site slightly before the reported 2348 wind shift time. | |||
<center> | <center> | ||
<imgloop delay=400 imgprefix="http://www.chill.colostate.edu/anim/30aug2011_KDEN_fine_line/" width=633 height=490> | <imgloop delay=400 imgprefix="http://www.chill.colostate.edu/anim/30aug2011_KDEN_fine_line/" width=633 height=490> | ||
10_30aug2011_kden.png | 10_30aug2011_kden.png|234349 UTC | ||
11_30aug2011_kden.png | 11_30aug2011_kden.png|234417 UTC | ||
12_30aug2011_kden.png | 12_30aug2011_kden.png|234445 UTC | ||
13_30aug2011_kden.png | 13_30aug2011_kden.png|234514 UTC | ||
14_30aug2011_kden.png | 14_30aug2011_kden.png|234542 UTC | ||
15_30aug2011_kden.png | 15_30aug2011_kden.png|234610 UTC | ||
16_30aug2011_kden.png | 16_30aug2011_kden.png|234639 UTC | ||
17_30aug2011_kden.png | 17_30aug2011_kden.png|234707 UTC | ||
18b_30aug2011_kden.png | 18b_30aug2011_kden.png|234735 UTC | ||
19b_30aug2011_kden.png | 19b_30aug2011_kden.png|234804 UTC | ||
</imgloop> | </imgloop> | ||
</center> | </center> | ||
==Summary and Conclusions== | |||
Throughout the boundary passage event, the prevailing visibility at KDEN remained high, the lowest cloud bases were in the 9 to 11,000 feet AGL height range, and no precipitation was reported. Despite the general lack of "weather" with fine line echoes of this type, the associated significant wind direction and speed changes can locally increase turbulence and can impose changes in runway usage. | |||
[[Category:Gust Front]] | |||
[[Category:Featured Articles]] | |||
Latest revision as of 10:08, 1 October 2011

CSU-CHILL reflectivity data recorded during a fine line passage at Denver International Airport on 30 August 2011. When this boundary passed the ASOS site, a shift in the observed surface wind direction occurred. Time lapse sequences showing the boundary's movement have been prepared.
Introduction
During the late afternoon hours of 30 August 2011, a fine line echo was approaching Denver International Airport (KDEN) from the northwest. To obtain high time resolution observations of the boundary's passage at the airport, the CSU-CHILL radar executed a 60 degree wide PPI sector scan composed of two elevation angles (0.5 and 0.9 degrees). This narrow sector gave a volume repeat time of ~28 seconds. The following plot identifies some of the radar base map features.

Reflectivity loop at 0.9 degree elevation angle
The fine line echo intensity was quite generally at or above 10 dBZ; localized maxima exceeded 18-20 dBZ. The echo extended outside of the horizontal domain used in the following image loop. The overall length was on the order of 100 km.
|
|
||
|
Radial velocity loop
Velocities in the vicinity of the airport were low prior to the arrival of the boundary. Velocities became positive (outbound from the radar) along the leading edge of the boundary.
|
|
||
|
Differential reflectivity loop
The fine line was characterized by highly positive Zdr values with many areas reaching 9 dB, the scaling limit used in storing CSU-CHILL Zdr data values. These large positive Zdr values are due to the highly oblate shapes of the insects that were collected by the convergent wind field along the fine line.
|
|
||
|
According the remarks in the KDEN surface weather reports, a wind shift took place at 2347 UTC. The winds had been light and variable before the boundary passage; at 2348 they were from 310 degrees at 18 knots gusting to 25 knots.

The wind speed and direction were measured by the Automated Surface Observing System (ASOS) which is located at the marked spot on the airport diagram shown below.

The following series of images shows an expanded view of the reflectivity field as the fine line as it reached the ASOS site. The contours start at 9 dBZ and increase in 3 dB steps. Due to the two minute running average used in the ASOS wind measuring system, the fine line echo reaches the instrumentation site slightly before the reported 2348 wind shift time.
|
|
||
|
Summary and Conclusions
Throughout the boundary passage event, the prevailing visibility at KDEN remained high, the lowest cloud bases were in the 9 to 11,000 feet AGL height range, and no precipitation was reported. Despite the general lack of "weather" with fine line echoes of this type, the associated significant wind direction and speed changes can locally increase turbulence and can impose changes in runway usage.