Example Multiple-Doppler Radar Analysis from the Colorado Front Range area: 31 Dec 2010: Difference between revisions
Pat kennedy (talk | contribs) (initial posting) |
(Added some more links and references) |
||
| (5 intermediate revisions by 2 users not shown) | |||
| Line 1: | Line 1: | ||
[[Image:31dec2010 uvtopo 2.8km yel c2.png|350px|right]] | |||
Low level (2.8 km MSL) horizontal wind field synthesized from CHILL, S-Pol and KFTG data; underlying colors depict terrain elevation. Additional plots typical of the analyses that will be supported by the FRONT ([http://www.eol.ucar.edu/instrumentation/remote-sensing/front-range-observational-network-testbed-front/front-range-observational-network-testbed-front Front Range Observational Network Testbed]) sensor array have been prepared from data collected during a recent snow event. | |||
==Introduction== | ==Introduction== | ||
During the winter of 2010 - 2011, NASA temporarily installed several | During the winter of 2010 - 2011, NASA temporarily installed several pieces of remote sensing equipment at the NOAA field site near Platteville, Colorado to collect data for a study of aircraft icing. To support this effort, the CSU-CHILL and EOL S-POL radars collected polarimetric data on several occasions when icing conditions were expected. It is anticipated that this "target of opportunity" radar operation regime is one of the data collection modes that will be used when the NCAR-CSU Front Range Observational Network Testbed (FRONT) becomes operational. This web page presents some examples of the data that can be collected routinely via coordinated operations of the EOL S-POL and CSU-CHILL radars while they are located at their home-base sites. | ||
pieces of remote sensing equipment at the NOAA field site near Platteville, | |||
Colorado to collect data for a study of aircraft icing. To support this | |||
effort, the CSU-CHILL and EOL S-POL radars collected polarimetric data on | |||
several occasions when icing conditions were expected. | |||
It is anticipated that this "target of opportunity" radar operation | |||
regime is one of the data collection modes that will be used when the NCAR-CSU | |||
Front Range Observational Network Testbed (FRONT) becomes operational. | |||
This web page presents some examples of the data that can be | |||
collected routinely via coordinated operations of the EOL S-POL and CSU-CHILL radars | |||
while they are located at their home-base sites. | |||
==IR Satellite Image at 0045 UTC== | ==IR Satellite Image at 0045 UTC== | ||
Widespread snow was forecast on 30 - 31 December 2010 due to the passage | Widespread snow was forecast on 30 - 31 December 2010 due to the passage of well-defined, synoptic scale trough system. At 0045 UTC on the 31st, [http://www.rap.ucar.edu/weather/satellite/ IR satellite imagery] showed that the circulation associated with this trough was developing a dry slot configuration over north-central Colorado. | ||
of well-defined, synoptic scale trough system. At 0045 UTC on the 31st, | |||
IR satellite imagery showed that the circulation associated with this trough | |||
was developing a dry slot configuration over north-central Colorado | |||
<center> | |||
[[Image:31dec2010 0045Z IR dry slot.png]] | [[Image:31dec2010 0045Z IR dry slot.png]] | ||
</center> | |||
==Multiple Doppler Wind Field Syntheses== | ==Multiple Doppler Wind Field Syntheses== | ||
The antenna controllers at CHILL and S-POL were automatically starting | The antenna controllers at CHILL and S-POL were automatically starting surveillance scan volumes at 7.5 minute intervals. 0045 UTC was one such synchronized starting time. The NWS KFTG radar started a volume scan at 0045:27 UTC. Due to the close agreement with the volume starting time of the research radars, a multiple-Doppler wind field synthesis could be done using the radial velocity data from all three radars. These analyses were done using NCAR's [http://www.mmm.ucar.edu/pdas/pdas.html SPRINT and CEDRIC software]. The resultant Earth-relative flow field at a height of 2.8 km MSL is shown below. The color fill is the CHILL reflectivity field; the strongest reflectivities are found near the eastern portion of the analysis grid in association with the colder IR cloud top area. | ||
surveillance scan volumes at 7.5 minute intervals. 0045 UTC was one such | |||
synchronized starting time. The NWS KFTG radar started a volume scan at | |||
0045:27 UTC. Due to the close agreement with the volume starting time of | |||
the research radars, a multiple-Doppler wind field synthesis could be done | |||
using the radial velocity data from all three radars. | |||
Earth-relative flow field at a height of 2.8 km MSL is shown below. The | |||
color fill is the CHILL reflectivity field; the strongest reflectivities | |||
are found near the eastern portion of the analysis grid in association | |||
with the colder IR cloud top area | |||
<center> | |||
[[Image:31dec2010 uvz 2.8km c1.png]] | [[Image:31dec2010 uvz 2.8km c1.png]] | ||
</center> | |||
The next image again shows the 2.8 km MSL flow vectors, now plotted on | The next image again shows the 2.8 km MSL flow vectors, now plotted on terrain elevation contours. (The elevations are in decameters; 150 = 1.5 km MSL) In the southwestern portion of the grid, it appears that the higher terrain of the foothills may have deflected the flow of cold, dense low level air towards the south. | ||
terrain elevation contours. (The elevations are in decameters; 150 = 1.5 km MSL) | |||
In the southwestern portion of the grid, it appears | |||
that the higher terrain of the foothills may have deflected the flow of | |||
cold, dense low level air towards the south | |||
<center> | |||
[[Image:31dec2010 uvtopo 2.8km yel c2.png]] | [[Image:31dec2010 uvtopo 2.8km yel c2.png]] | ||
</center> | |||
500m higher up at the 3.8 km MSL analysis level, winds had | 500m higher up at the 3.8 km MSL analysis level, winds had strengthened and generally shifted to a more southerly direction. This plot also shows the location of an RHI scan done by S-POL at 0052 UTC. | ||
strengthened and generally shifted to a more southerly direction. This | |||
plot also shows the location of an RHI scan done | |||
by S-POL at 0052 UTC | |||
<center> | |||
[[Image:31dec2010 uvz 3.3km c2.png]] | [[Image:31dec2010 uvz 3.3km c2.png]] | ||
</center> | |||
==S-Pol RHI Scan Data== | ==S-Pol RHI Scan Data== | ||
The final plot was made from the SPOL RHI scan data. The color | The final plot was made from the SPOL RHI scan data. The color fill is reflectivity; contours showing the 0.1 and 0.15 deg / km one-way specific differential phase (<math>K_{dp}</math>) levels are shown as an overlay. (The green dots on the RHI line in the preceding plot show the 90 and 100 km range points that approximately bracket the positive <math>K_{dp}</math> area.) This weak positive <math>K_{dp}</math> area is probably due to a relatively high concentration of quasi-horizontally oriented planar ice crystals. The aggregation of these crystals into irregularly-shaped clumps at lower heights causes <math>K_{dp}</math> to decrease and reflectivity to increase towards the ground. | ||
fill is reflectivity; contours showing the 0.1 and 0.15 deg / km | |||
specific differential phase ( | |||
(The green dots on the RHI line in the preceding plot show the | |||
90 and 100 km range points that approximately bracket the positive | |||
due to a relatively high concentration | |||
of quasi-horizontally oriented planar ice crystals. The aggregation | |||
of these crystals into irregularly-shaped clumps at lower heights | |||
causes | |||
<center> | |||
[[Image:31dec2010 SPOL RHI Z Kdp c1.png]] | [[Image:31dec2010 SPOL RHI Z Kdp c1.png]] | ||
</center> | |||
The data presented here are representative of the type of measurements that the FRONT radar network will readily be able to provide to the atmospheric research and education communities. | |||
==References== | |||
* Jay Miller, L., Carl G. Mohr, Andrew J. Weinheimer, 1986: [http://journals.ametsoc.org/doi/abs/10.1175/1520-0426%281986%29003%3C0162%3ATSRTCS%3E2.0.CO%3B2 The Simple Rectification to Cartesian Space of Folded Radial Velocities from Doppler Radar Sampling.] ''J. Atmos. Oceanic Technol.'', '''3''', 162–174. | |||
* The [http://www.eol.ucar.edu/instrumentation/remote-sensing/front-range-observational-network-testbed-front/front-range-observational-network-testbed-front FRONT Web Page] | |||
* The [http://www.mmm.ucar.edu/pdas/pdas.html NCAR Data analysis software Web Page] | |||
==Acknowledgments== | |||
Jay Miller and John Tuttle provided the digital terrain elevation data set. Bob Rilling made the S-POL data files available on a short turn-around basis. (Jay, John, and Bob are all affiliated with NCAR). | |||
[[Category:Featured Articles]] | |||
[[Category:Multiple Doppler]] | |||
[[Category:FRONT]] | |||
Latest revision as of 10:42, 1 February 2011
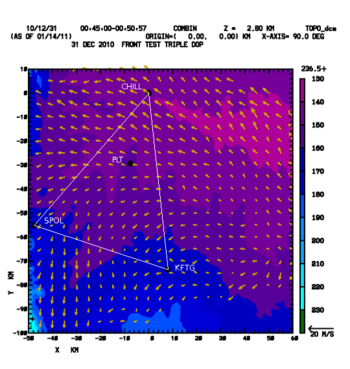
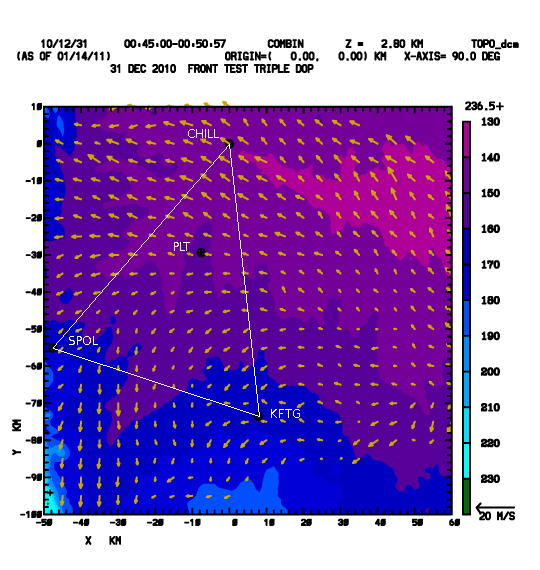
Low level (2.8 km MSL) horizontal wind field synthesized from CHILL, S-Pol and KFTG data; underlying colors depict terrain elevation. Additional plots typical of the analyses that will be supported by the FRONT (Front Range Observational Network Testbed) sensor array have been prepared from data collected during a recent snow event.
Introduction
During the winter of 2010 - 2011, NASA temporarily installed several pieces of remote sensing equipment at the NOAA field site near Platteville, Colorado to collect data for a study of aircraft icing. To support this effort, the CSU-CHILL and EOL S-POL radars collected polarimetric data on several occasions when icing conditions were expected. It is anticipated that this "target of opportunity" radar operation regime is one of the data collection modes that will be used when the NCAR-CSU Front Range Observational Network Testbed (FRONT) becomes operational. This web page presents some examples of the data that can be collected routinely via coordinated operations of the EOL S-POL and CSU-CHILL radars while they are located at their home-base sites.
IR Satellite Image at 0045 UTC
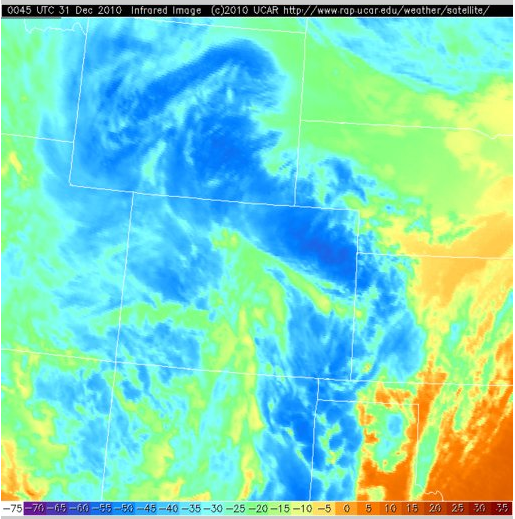
Widespread snow was forecast on 30 - 31 December 2010 due to the passage of well-defined, synoptic scale trough system. At 0045 UTC on the 31st, IR satellite imagery showed that the circulation associated with this trough was developing a dry slot configuration over north-central Colorado.
Multiple Doppler Wind Field Syntheses
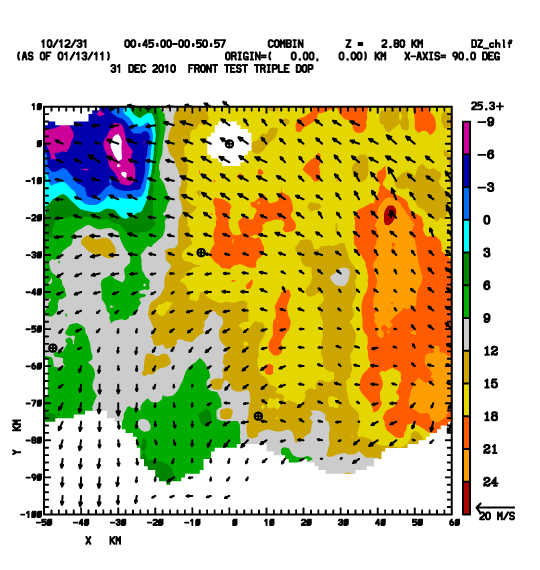
The antenna controllers at CHILL and S-POL were automatically starting surveillance scan volumes at 7.5 minute intervals. 0045 UTC was one such synchronized starting time. The NWS KFTG radar started a volume scan at 0045:27 UTC. Due to the close agreement with the volume starting time of the research radars, a multiple-Doppler wind field synthesis could be done using the radial velocity data from all three radars. These analyses were done using NCAR's SPRINT and CEDRIC software. The resultant Earth-relative flow field at a height of 2.8 km MSL is shown below. The color fill is the CHILL reflectivity field; the strongest reflectivities are found near the eastern portion of the analysis grid in association with the colder IR cloud top area.
The next image again shows the 2.8 km MSL flow vectors, now plotted on terrain elevation contours. (The elevations are in decameters; 150 = 1.5 km MSL) In the southwestern portion of the grid, it appears that the higher terrain of the foothills may have deflected the flow of cold, dense low level air towards the south.
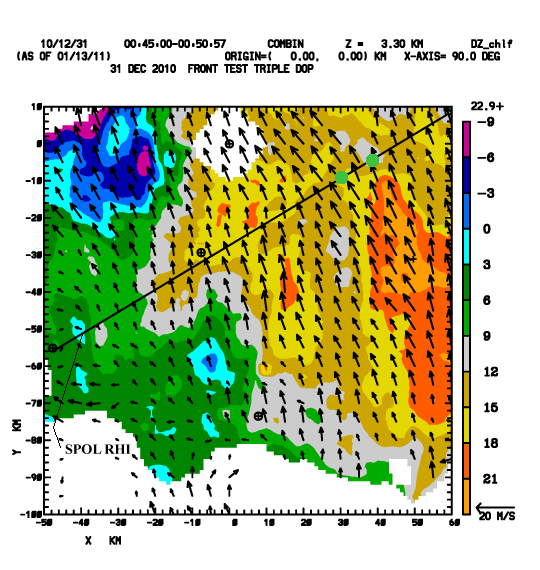
500m higher up at the 3.8 km MSL analysis level, winds had strengthened and generally shifted to a more southerly direction. This plot also shows the location of an RHI scan done by S-POL at 0052 UTC.
S-Pol RHI Scan Data
The final plot was made from the SPOL RHI scan data. The color fill is reflectivity; contours showing the 0.1 and 0.15 deg / km one-way specific differential phase () levels are shown as an overlay. (The green dots on the RHI line in the preceding plot show the 90 and 100 km range points that approximately bracket the positive area.) This weak positive area is probably due to a relatively high concentration of quasi-horizontally oriented planar ice crystals. The aggregation of these crystals into irregularly-shaped clumps at lower heights causes to decrease and reflectivity to increase towards the ground.
The data presented here are representative of the type of measurements that the FRONT radar network will readily be able to provide to the atmospheric research and education communities.
References
- Jay Miller, L., Carl G. Mohr, Andrew J. Weinheimer, 1986: The Simple Rectification to Cartesian Space of Folded Radial Velocities from Doppler Radar Sampling. J. Atmos. Oceanic Technol., 3, 162–174.
- The FRONT Web Page
Acknowledgments
Jay Miller and John Tuttle provided the digital terrain elevation data set. Bob Rilling made the S-POL data files available on a short turn-around basis. (Jay, John, and Bob are all affiliated with NCAR).
