Evolution of radial velocity and rain rate fields in low elevation PPI sweeps of a thunderstorm: 30 July 2010: Difference between revisions
Pat kennedy (talk | contribs) (initial posting) |
(Reformatted first paragraph) |
||
| (6 intermediate revisions by 2 users not shown) | |||
| Line 1: | Line 1: | ||
==Reflectivity== | [[Image:30jul2010 rain vr composite.png|250px|right]] | ||
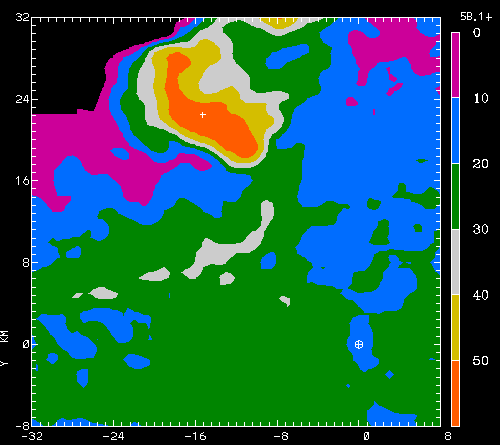
Low elevation PPI scan through heavy rain and divergent outflow beneath a thunderstorm located a short distance Northwest of the CSU-CHILL radar site. A sequence of similar plots has been developed for a 40 minute portion of the storm's lifetime. | |||
==Reflectivity (dBZ)== | |||
The following series of images were generated using the NCAR SPRINT program to interpolate 1.5 degree elevation angle PPI data to a set of Cartesian gridpoints with spacings of 500m in the X and Y directions. (In the vertical direction, these gridpoints remained on the 1.5 degree elevation PPI surface). The images are at time intervals of slightly more than 4 minutes, during an overall time period of approximately 41 minutes. With time, stronger reflectivity levels appear in the southern portion of the echo core. A separate line of enhanced reflectivities associated with a gust front can be seen advancing ahead of the storm. | |||
<center> | <center> | ||
<imgloop delay=400 imgprefix="http://www.chill.colostate.edu/anim/30jul2010_rain_outflow/" width=500 height=445> | <imgloop delay=400 imgprefix="http://www.chill.colostate.edu/anim/30jul2010_rain_outflow/" width=500 height=445> | ||
z1.png | z1.png |2048:38 UTC | ||
z2.png | z2.png |2052:47 UTC | ||
z3.png | z3.png |2056:56 UTC | ||
z4.png | z4.png |2101:05 UTC | ||
z5.png | z5.png |2105:15 UTC | ||
z6.png | z6.png |2109:24 UTC | ||
z7.png | z7.png |2113:33 UTC | ||
z8.png | z8.png |2117:43 UTC | ||
z9.png | z9.png |2121:52 UTC | ||
z10.png | z10.png |2126:01 UTC | ||
z11.png | z11.png |2130:11 UTC | ||
</imgloop> | </imgloop> | ||
</center> | </center> | ||
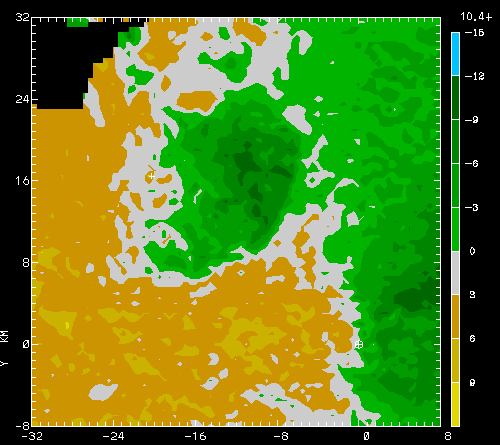
==Radial Velocity== | ==Radial Velocity (mps)== | ||
A divergent radial velocity pattern becomes increasingly evident in association with the appearance of the stronger reflectivities towards the end of the loop. At the time of the next to the last frame (number 10 / 2126:01 UTC), the convergent air flow associated with the gust front causes negative (inbound) radial velocities to almost entirely surround the radar site. | |||
<center> | <center> | ||
<imgloop delay=400 imgprefix="http://www.chill.colostate.edu/anim/30jul2010_rain_outflow/" width=500 height=445> | <imgloop delay=400 imgprefix="http://www.chill.colostate.edu/anim/30jul2010_rain_outflow/" width=500 height=445> | ||
v1.png | v1.png |2048:38 UTC | ||
v2.png | v2.png |2052:47 UTC | ||
v3.png | v3.png |2056:56 UTC | ||
v4.png | v4.png |2101:05 UTC | ||
v5.png | v5.png |2105:15 UTC | ||
v6.png | v6.png |2109:24 UTC | ||
v7.png | v7.png |2113:33 UTC | ||
v8.png | v8.png |2117:43 UTC | ||
v9.png | v9.png |2121:52 UTC | ||
v10.png | v10.png |2126:01 UTC | ||
v11.png | v11.png |2130:11 UTC | ||
</imgloop> | </imgloop> | ||
</center> | </center> | ||
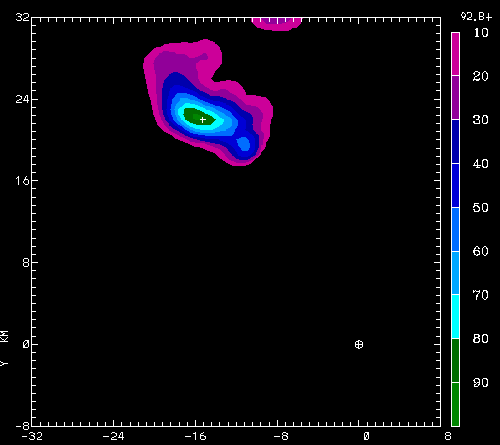
==Rain | ==Rain Rate (mm/hr)== | ||
Instantaneous rain rates were computed from the reflectivity, differential reflectivity and specific propagation differential phase data using the CSU HIDRO methods described in Cifelli et al (JTEC, March 2011). Rain rates in excess of 150 mm / hr appear as the strong, microburst-scale outflow develops at 2113:33 UTC (frame 11). | |||
<center> | <center> | ||
<imgloop delay=400 imgprefix="http://www.chill.colostate.edu/anim/30jul2010_rain_outflow/" width=500 height=445> | <imgloop delay=400 imgprefix="http://www.chill.colostate.edu/anim/30jul2010_rain_outflow/" width=500 height=445> | ||
r1.png | r1.png |2048:38 UTC | ||
r2.png | r2.png |2052:47 UTC | ||
r3.png | r3.png |2056:56 UTC | ||
r4.png | r4.png |2101:05 UTC | ||
r5.png | r5.png |2105:15 UTC | ||
r6.png | r6.png |2109:24 UTC | ||
r7.png | r7.png |2113:33 UTC | ||
r8.png | r8.png |2117:43 UTC | ||
r9.png | r9.png |2121:52 UTC | ||
r10.png | r10.png |2126:01 UTC | ||
r11.png | r11.png |2130:11 UTC | ||
</imgloop> | </imgloop> | ||
</center> | </center> | ||
==Outflow Photograph== | |||
The following photograph was taken looking North at 2136:40 UTC, shortly after the radar data sequence shown above. Dust raised by the approaching storm outflow partially obscures the trees on the horizon near the center of the picture. The storm passage deposited 0.59 inches of rain in the CoCoRaHS precipitation gauge at the radar. | |||
[[Image:30jul2010 dust.JPG|500px|center]] | |||
==References== | |||
* R. Cifelli, V. Chandrasekar, S. Lim, P. C. Kennedy, Y. Wang, S. A. Rutledge: [http://journals.ametsoc.org/doi/abs/10.1175/2010JTECHA1488.1 A New Dual-Polarization Radar Rainfall Algorithm: Application in Colorado Precipitation Events] Journal of Atmospheric and Oceanic Technology, '''28''', pp. 352-364 | |||
[[Category:Featured Articles]] | |||
[[Category:Heavy Rain]] | |||
Latest revision as of 23:54, 10 June 2011

Low elevation PPI scan through heavy rain and divergent outflow beneath a thunderstorm located a short distance Northwest of the CSU-CHILL radar site. A sequence of similar plots has been developed for a 40 minute portion of the storm's lifetime.
Reflectivity (dBZ)
The following series of images were generated using the NCAR SPRINT program to interpolate 1.5 degree elevation angle PPI data to a set of Cartesian gridpoints with spacings of 500m in the X and Y directions. (In the vertical direction, these gridpoints remained on the 1.5 degree elevation PPI surface). The images are at time intervals of slightly more than 4 minutes, during an overall time period of approximately 41 minutes. With time, stronger reflectivity levels appear in the southern portion of the echo core. A separate line of enhanced reflectivities associated with a gust front can be seen advancing ahead of the storm.
|
|
||
|
Radial Velocity (mps)
A divergent radial velocity pattern becomes increasingly evident in association with the appearance of the stronger reflectivities towards the end of the loop. At the time of the next to the last frame (number 10 / 2126:01 UTC), the convergent air flow associated with the gust front causes negative (inbound) radial velocities to almost entirely surround the radar site.
|
|
||
|
Rain Rate (mm/hr)
Instantaneous rain rates were computed from the reflectivity, differential reflectivity and specific propagation differential phase data using the CSU HIDRO methods described in Cifelli et al (JTEC, March 2011). Rain rates in excess of 150 mm / hr appear as the strong, microburst-scale outflow develops at 2113:33 UTC (frame 11).
|
|
||
|
Outflow Photograph
The following photograph was taken looking North at 2136:40 UTC, shortly after the radar data sequence shown above. Dust raised by the approaching storm outflow partially obscures the trees on the horizon near the center of the picture. The storm passage deposited 0.59 inches of rain in the CoCoRaHS precipitation gauge at the radar.

References
- R. Cifelli, V. Chandrasekar, S. Lim, P. C. Kennedy, Y. Wang, S. A. Rutledge: A New Dual-Polarization Radar Rainfall Algorithm: Application in Colorado Precipitation Events Journal of Atmospheric and Oceanic Technology, 28, pp. 352-364