Evolution of a three body scattering signature: 26 May 2010: Difference between revisions
Pat kennedy (talk | contribs) No edit summary |
Pat kennedy (talk | contribs) (additional text added) |
||
| Line 3: | Line 3: | ||
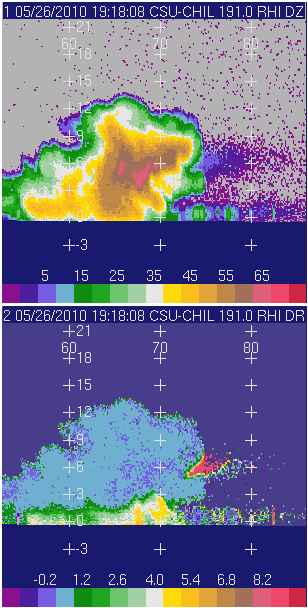
==RHI Data== | ==RHI Data== | ||
The following sequence of RHI scans were all collected on an azimuth of | |||
191 degrees. In each image frame the upper panel is reflectivity and the | |||
lower panel is differential reflectivity. The development and descent of | |||
the intense reflectivity area is apparent. In the differential | |||
reflectivity data, a region of anomalously positive Zdr values develops in | |||
the three body scattering region down range of the storm. This is one of | |||
the differential reflectivity characteristics of three body echoes that | |||
were reported in Hubbert and Bringi (J. Atmos. Oceanic Tech., January, 2000, 51-61). | |||
<center> | <center> | ||
<imgloop delay=400 imgprefix="http://www.chill.colostate.edu/anim/26may2010_three_body/" width=308 height=608> | <imgloop delay=400 imgprefix="http://www.chill.colostate.edu/anim/26may2010_three_body/" width=308 height=608> | ||
| Line 10: | Line 18: | ||
26may2010_1932_RHI.png | 26may2010_1932_RHI.png | ||
</imgloop> | </imgloop> | ||
</center> | |||
<hr> | |||
The next plot includes the radial velocity field observed in the final RHI | |||
of the above time lapse sequence. The spatial variability of the radial | |||
velocities is relatively smooth in the thunderstorm echo; the velocity | |||
variability is visibly greater in the three body region. Due to the large | |||
fall velocity of the hailstones, the radial velocities in the three body | |||
echo are also predominately negative (Wilson and Reum, J. Atmos. Oceanic Tech., April 1988, 197-205). | |||
<center> | |||
[[Image:26may2010 3 body VT anot.png]] | [[Image:26may2010 3 body VT anot.png]] | ||
</center> | </center> | ||
<hr> | <hr> | ||
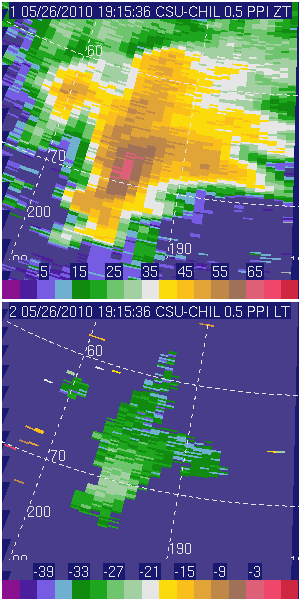
==PPI Data== | ==PPI Data== | ||
A short loop of 0.5 degree elevation PPI scans that bracket the RHI image | |||
loop period is shown below. In these images, the upper panel is | |||
reflectivity and the lower panel is linear depolarization ratio (Ldr). As | |||
hail becomes an increasingly large component of the precipitation, the | |||
reflectivity levels approach 70 dBZ and the Ldr values increase to ~ -15 | |||
dB. The final PPI image time is 1932:37 UTC. The SPC severe weather | |||
report records contain an observation of damage-producing 2 inch diameter | |||
hail from this storm in Commerce City at 1933 UTC. | |||
<center> | <center> | ||
<imgloop delay=400 imgprefix="http://www.chill.colostate.edu/anim/26may2010_three_body/" width=300 height=600> | <imgloop delay=400 imgprefix="http://www.chill.colostate.edu/anim/26may2010_three_body/" width=300 height=600> | ||
Revision as of 12:04, 28 June 2010
Introduction
Echoes due to three body scattering are typically seen down-range of thunderstorms that contain high reflectivity regions located at heights of several km above the ground. When these high reflectivity areas are illuminated by the radar pulse, they re-radiate a scattered component of the incident energy in all directions. Some of this scattered energy is reflected off of the underlying ground surface, producing a re-illumination of particles in the pulse volume. A portion of this re-scattered energy is directed back towards the radar where it may result in a detectable echo. The lengthened path travelled by these signals (radar -> hydrometeors -> ground -> back to hydrometeors -> back to the radar) causes them to appear as down-range extensions of the generating thunderstorm echo. The presence of hailstones aloft with significant diameters and concentrations can cause the appearance of the three body signature. During CSU-CHILL operations on 26 May 2010, an intensifying hailstorm was observed to develop an increasingly well defined three body signature.
RHI Data
The following sequence of RHI scans were all collected on an azimuth of 191 degrees. In each image frame the upper panel is reflectivity and the lower panel is differential reflectivity. The development and descent of the intense reflectivity area is apparent. In the differential reflectivity data, a region of anomalously positive Zdr values develops in the three body scattering region down range of the storm. This is one of the differential reflectivity characteristics of three body echoes that were reported in Hubbert and Bringi (J. Atmos. Oceanic Tech., January, 2000, 51-61).
|
|
||
|
The next plot includes the radial velocity field observed in the final RHI of the above time lapse sequence. The spatial variability of the radial velocities is relatively smooth in the thunderstorm echo; the velocity variability is visibly greater in the three body region. Due to the large fall velocity of the hailstones, the radial velocities in the three body echo are also predominately negative (Wilson and Reum, J. Atmos. Oceanic Tech., April 1988, 197-205).

PPI Data
A short loop of 0.5 degree elevation PPI scans that bracket the RHI image loop period is shown below. In these images, the upper panel is reflectivity and the lower panel is linear depolarization ratio (Ldr). As hail becomes an increasingly large component of the precipitation, the reflectivity levels approach 70 dBZ and the Ldr values increase to ~ -15 dB. The final PPI image time is 1932:37 UTC. The SPC severe weather report records contain an observation of damage-producing 2 inch diameter hail from this storm in Commerce City at 1933 UTC.
|
|
||
|