Dual wavelength hail detection: 26 September 2012
Introduction
During test operations of the CSU-CHILL radar's dual wavelength (11 and 3 cm) configuration, a thunderstorm that was producing sub-severe (less than 1 inch diameter) hail was observed on 26 September 2012. Differences between the reflectivities observed at these two wavelengths can be used to infer the presence hailstones. When hailstone diameters reach ~ 1 cm, Mie scattering effects begin to reduce the backscattering cross section at the 3 cm wavelength, reducing the reflectivity level. Scattering at the longer 11 cm wavelength remains in the Rayleigh regime, so the backscattering cross section (and reflectivity) continues to increase with hailstone diameter.
Reflectivity data
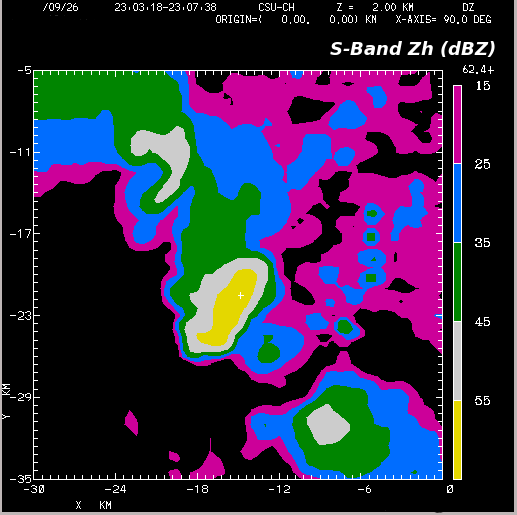
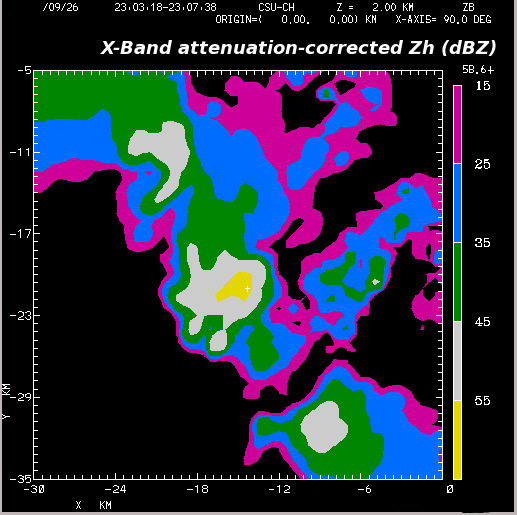
The data observed at the two wavelengths were interpolated to a common 500 m horizontal mesh 3D Cartesian using the NCAR REORDER program. The grid X,Y origin is at the radar. The following two plots show the reflectivity data at the 2 km MSL (~500m AGL) height level. An attenuation correction has been applied to the 3 cm data. The reflectivity values are generally in good agreement except in the cell located near X=-17, Y=-22 km, where the 3 cm reflectivities are notably less than those observed at 11 cm.


Dual wavelength hail signal
Following Herzegh and Jameson (BAMS 1992, xxx), the dual wavelength hail signal is calculated by subtracting the attenuation-corrected 3 cm reflectivity from the 11 cm reflectivity and regions where this difference exceed 6 dB are identified. The solid contour line in the following plot shows that the hail signal level exceed the 6 dB threshold in the central echo core.

11 cm wavelength polarimetric data
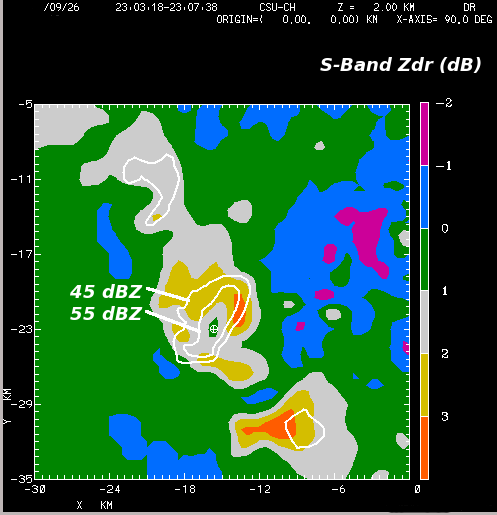
Differential reflectivity (Zdr) data can also be used to infer the presence of hail within convective echoes. The tumbling motions of the hailstones tends to equalize the horizontally and vertically polarized received signal levels, producing near 0 dB Zdr values. The 11 cm wavelength Zdr data is shown as a color-fill in the following plot; solid contour lines depict the 45 and 55 dBZ reflectivity levels. A Zdr reduction due to hail is evident within the echo core. (A reference mark has been added at the minimum Zdr location.)

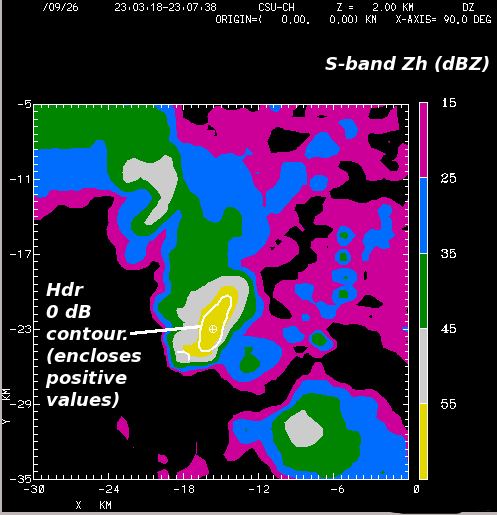
Aydin et al (JAM, 1984) developed the Hail Differential Reflectivity (Hdr) parameter as
