Dual-Doppler snapshot of a tornadic thunderstorm: 22 May 2008
Intoduction
Around mid-day on 22 May 2008 a tornadic supercell thunderstorm tracked towards the north-northwest across portions of Weld and Larimer Counties in northeastern Colorado. On this date, the CSU-CHILL radar's antenna control software was in the process of being adapted to the inertial characteristics of the new dual offset feed antenna that had been installed earlier in the year. Computer control of the antenna's elevation axis motion was not yet possible. In an effort to collect some data from this severe weather event, the antenna was mechanically locked at a fixed elevation angle of 1.4 degrees. Continuous 360 degree PPI scans at this single elevation angle were started at 1819 UTC. (The storm struck the eastern portions of city of Windsor around 1757 UTC, causing EF-3 damage.)
When the CSU-CHILL observations started, the storm had just crossed I-25 approximately 9 km northeast of downtown Ft. Collins. The CHILL PPI sweep that started at 1821:11 UTC was well synchronized with the volume scan that the Cheyenne, WY WSR-88D (KCYS) radar began at 1821:03 UTC. To perform a dual Doppler wind field synthesis from these input volumes, a common set of Cartesian grid points (suitable for use by both radars) had to be identified. Interpolation of the CHILL data using a nearest-neighbor procedure with an influence radius of 0.5 km resulted in acceptable grid-filling at the 2.8 km MSL CAPPI height. (This was also the approximate beam height in the area of interest.) Since the vertical component of the interpolation procedure merely moved the data to the 2.8 km MSL (~1.2 km AGL) height level, the Cartesian representations of the CHILL data fields are degraded by the lack of the vertical resolution that PPI sweeps at additional elevation angles would have provided.
The NCAR CEDRIC software package was used for all processing and plotting of the gridded data sets A horizontal mesh size of 0.5 km was used in the interpolation grid; the origin is located at the CHILL radar. Based on the observed motion vector of the parent storm, an advection correction to an analysis time of 1822 UTC was applied to the gridded input data fields.
Horizontal wind and reflectivity fields
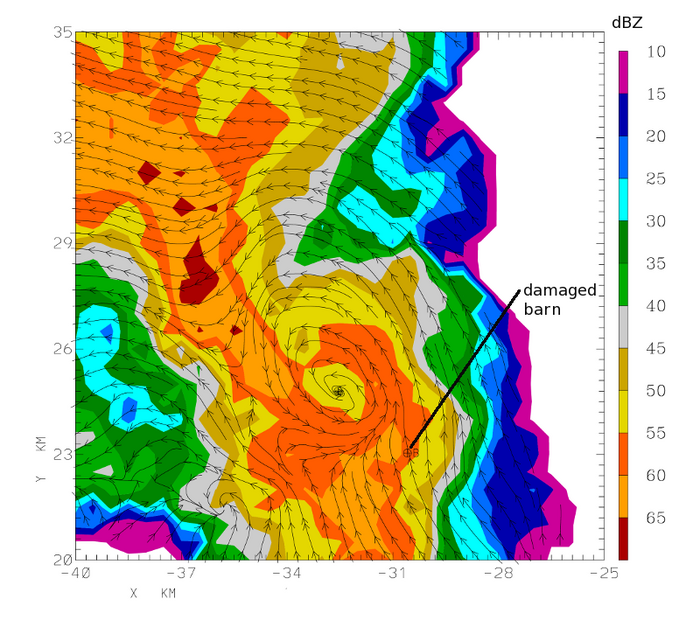
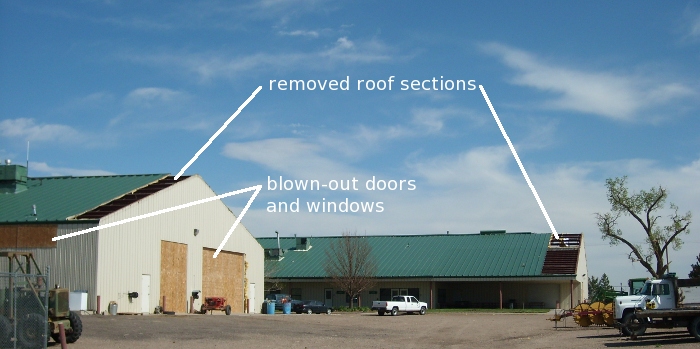
The Earth-relative horizontal flow field based on the dual-Doppler wind component reconstruction is shown by streamlines in the following plot. The mesocyclone circulation was still well-defined at 1822 UTC. Partial roof removal took place at a CSU agricultural research farm as the storm crossed I-25 a few minutes before the analysis time. The post-storm survey conducted by the BOU NWS office indicated that the tornado damage path ended a short distance west of I-25. Localized surface damage was documented at points along the portion of the mesocyclone track that was observed by the CSU-CHILL radar.
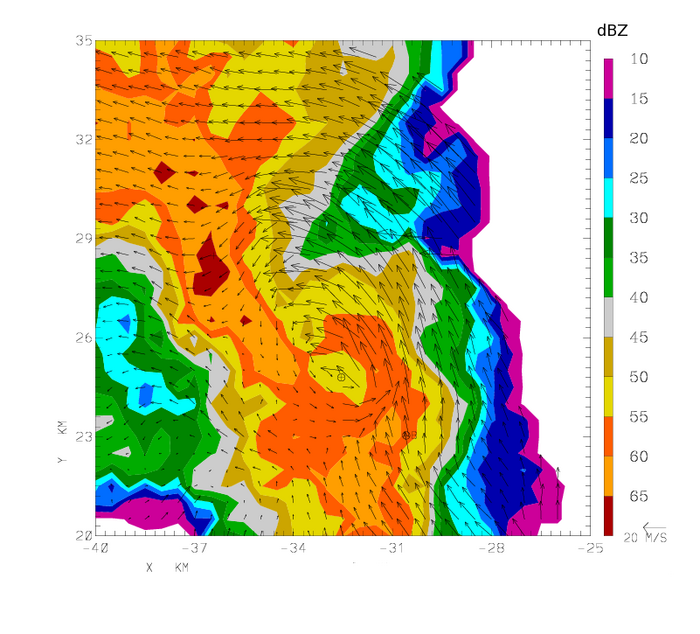
A vector representation of this same dual-Doppler flow field is shown in the next plot:
Damage photograph taken on 24 May 2008 at the CSU research farm property. (Location marked as "damaged barn" in the reflectivity data plot shown above):
Differential Reflectivity () and co-polar correlation (RhoHV) fields
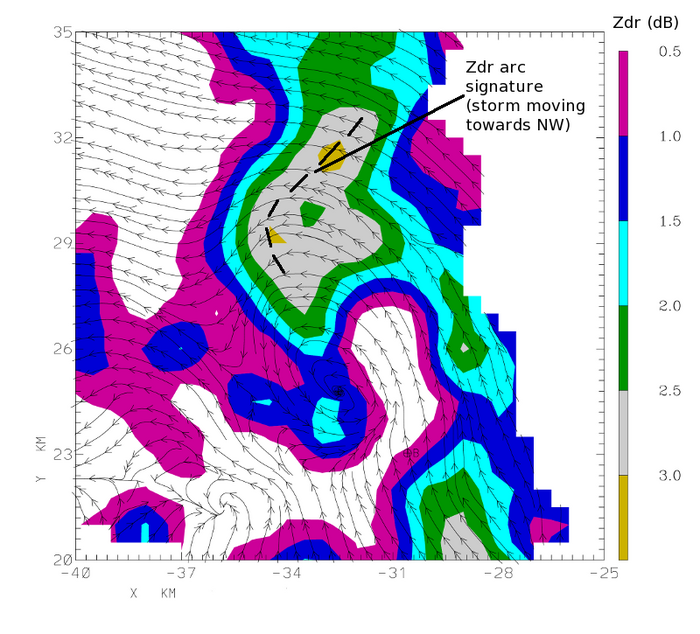
The CSU-CHILL polarimetric data fields observed at 1822 UTC contained several features that have been identified in supercell thunderstorms by Kumjian and Ryzhkov[1] (2007). One prominent feature in the supercell field is the axis of positive values marked in the plot shown below. This area was located along the reflectivity gradient region that was adjacent to the low level inflow to the mesocyclone. According to Kumjian and Ryzhkov (2007), the marked shear of the horizontal winds with height in this area causes differences to develop in the fall trajectories of the large vs. small diameter components of the raindrop size distribution. The arc signature develops in areas where the trajectory sorting effects have left a predominance of relatively large, oblate drops.
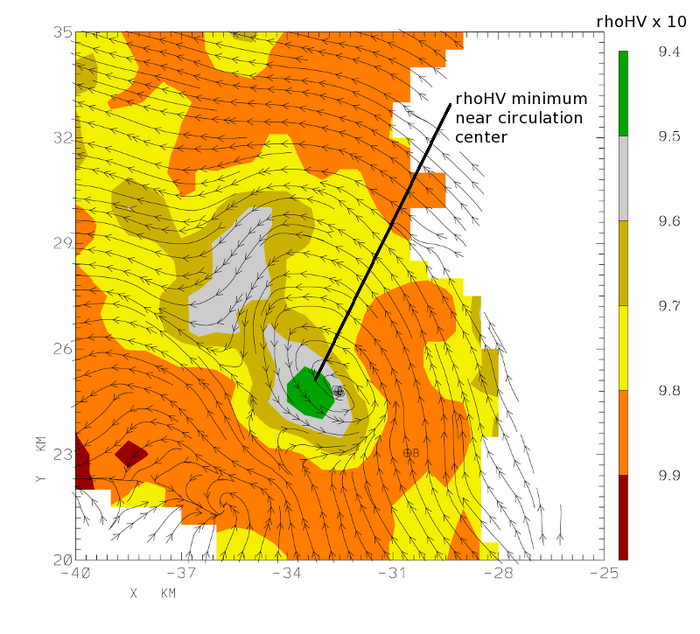
The following plot shows the co-polar H,V correlation field (rhoHV); the values have been scaled up by a factor of 10. The correlation field contained a localized minimum in close proximity to the center of the mesocyclone. When strong surface winds are able to loft irregularly-shaped, non-hydrometeor scatterers (i.e., various types of debris picked up from the surface) into the radar pulse volume, rhoHV values will be reduced.
External References and Links
References
Links
- RAMMB / CIRA case study
- Weld county tornado of May 22 2008 rated an EF3 tornado - Official NOAA damage report
