Differential attenuation patterns: 19 August 2011: Difference between revisions
Pat kennedy (talk | contribs) (plots added) |
Pat kennedy (talk | contribs) No edit summary |
||
| Line 1: | Line 1: | ||
==Introduction== | ==Introduction== | ||
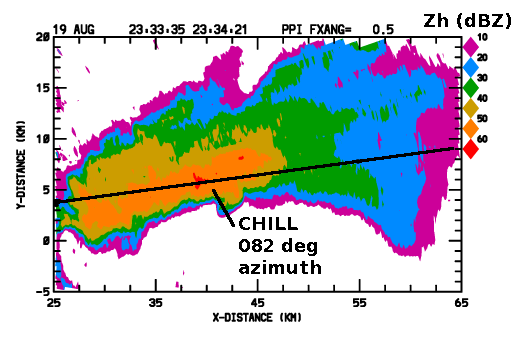
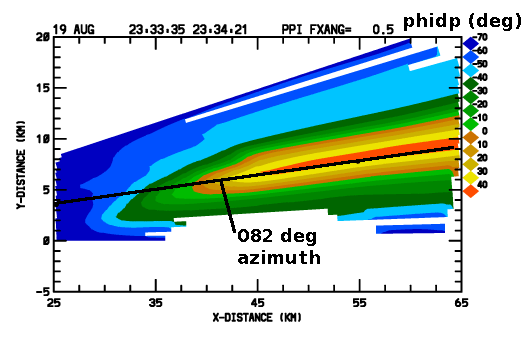
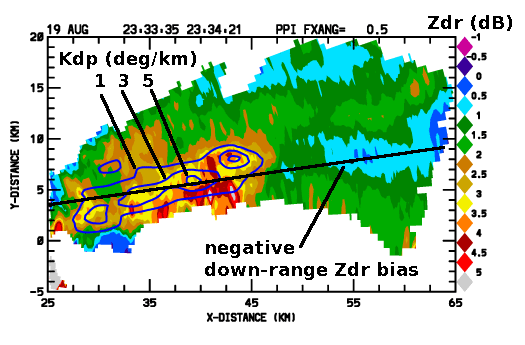
Scattered thunderstorms developed in several portions of the CSU-CHILL coverage area during the afternoon hours of 19 August 2011. For an ~10 minute time period, the storms developing a short distance east of the radar produced | Scattered thunderstorms developed in several portions of the CSU-CHILL coverage area during the afternoon hours of 19 August 2011. For an ~10 minute time period, the storms developing a short distance east of the radar produced an echo pattern with a maximum reflectivity axis that was radially aligned with the radar. Radar pulses propagating along this heavy rain axis experienced the accumulated effects of high concentrations of oblate raindrops: The greater retardation experienced by the H polarized waves relative to the V polarized waves caused large differential propagation phase (<math>\phi_{dp}</math>) shifts to be observed. The oblate drops also made the attenuation losses greater for the H waves than for the V waves. The resultant preferential weakening of the H signal level introduced a negative bias into the Differential Reflectivity (<math>Z_{dr}</math> ) values.These effects are shown in the following plots made from a low elevation PPI scan through the heavy rain area. | ||
==Reflectivity== | ==Reflectivity== | ||
[[Image:19aug2011 zc anot.png|center]] | [[Image:19aug2011 zc anot.png|center]] | ||
==Differential propagation phase== | ==Differential propagation phase (<math>\phi_{dp}</math>)== | ||
[[Image:19aug2011 pf anot.png|center]] | [[Image:19aug2011 pf anot.png|center]] | ||
==Differential reflectivity== | ==Differential reflectivity (<math>Z_{dr}</math>)== | ||
[[Image:19aug2011 dc kdp anot.png|center]] | [[Image:19aug2011 dc kdp anot.png|center]] | ||
Revision as of 05:40, 26 October 2011
Introduction
Scattered thunderstorms developed in several portions of the CSU-CHILL coverage area during the afternoon hours of 19 August 2011. For an ~10 minute time period, the storms developing a short distance east of the radar produced an echo pattern with a maximum reflectivity axis that was radially aligned with the radar. Radar pulses propagating along this heavy rain axis experienced the accumulated effects of high concentrations of oblate raindrops: The greater retardation experienced by the H polarized waves relative to the V polarized waves caused large differential propagation phase () shifts to be observed. The oblate drops also made the attenuation losses greater for the H waves than for the V waves. The resultant preferential weakening of the H signal level introduced a negative bias into the Differential Reflectivity ( ) values.These effects are shown in the following plots made from a low elevation PPI scan through the heavy rain area.
Reflectivity

Differential propagation phase ()

Differential reflectivity ()


