Differential attenuation patterns: 19 August 2011: Difference between revisions
Pat kennedy (talk | contribs) (added overview) |
(→References: Fixed reference formatting) |
||
| (2 intermediate revisions by 2 users not shown) | |||
| Line 1: | Line 1: | ||
[[Image:Diff atten intro anot.png|350px|right]] | |||
[[Image:Diff atten intro anot.png| | |||
A thunderstorm produced an axis of heavy rain that was positioned along a radial from the CSU-CHILL radar on 19 August 2011. Plots showing the resultant differential attenuation effects on <math>Z_{dr}</math> have been prepared. | A thunderstorm produced an axis of heavy rain that was positioned along a radial from the CSU-CHILL radar on 19 August 2011. Plots showing the resultant differential attenuation effects on <math>Z_{dr}</math> have been prepared. | ||
| Line 12: | Line 10: | ||
==Differential propagation phase (<math>\phi_{dp}</math>)== | ==Differential propagation phase (<math>\phi_{dp}</math>)== | ||
The filtered <math>\phi_{dp}</math> field for the same PPI sweep is shown in the plot below. The color changes along the 082 degree azimuth indicate a net phase change of ~100 degrees during the transit through the high reflectivity region. (Medium blue (-60 degrees at 28 km range shifting to orange (+40 degrees) at 45 km.) This major increase in the lag of the phase of the received H signal in comparison to the V return implies that a high spatial concentration of oblate raindrops (i.e., intense rain | The filtered <math>\phi_{dp}</math> field for the same PPI sweep is shown in the plot below. The color changes along the 082 degree azimuth indicate a net phase change of ~100 degrees during the transit through the high reflectivity region. (Medium blue (-60 degrees at 28 km range shifting to orange (+40 degrees) at 45 km.) This major increase in the lag of the phase of the received H signal in comparison to the V return implies that a high spatial concentration of oblate raindrops (i.e., intense rain rate) exists along this beam path. | ||
[[Image:19aug2011 pf anot.png|center]] | [[Image:19aug2011 pf anot.png|center]] | ||
| Line 18: | Line 16: | ||
The rate of change of the filtered <math>\phi_{dp}</math> values per range interval along the radial beam path defines specific differential propagation phase (Kdp). In the following plot, Kdp values are shown as solid blue contour lines. At the CHILL's operating wavelength, the detection of Kdp values in excess of 3 deg / km indicates rain rates in excess of 100 mm / hr. Differential reflectivity data are shown by the color-filled field. Down-range of the heavy rain area, a radially-aligned region of locally reduced <math>Z_{dr}</math> values is apparent. The larger propagation losses experienced by the H waves relative to the V waves during the transit through the oblate raindrops induces this <math>Z_{dr}</math> reduction. Efforts should be made to correct for these differential attenuation effects when quantative use is being made of <math>Z_{dr}</math> data (Bringi et al., JTEC 1990, p. 829). | The rate of change of the filtered <math>\phi_{dp}</math> values per range interval along the radial beam path defines specific differential propagation phase (Kdp). In the following plot, Kdp values are shown as solid blue contour lines. At the CHILL's operating wavelength, the detection of Kdp values in excess of 3 deg / km indicates rain rates in excess of 100 mm / hr. Differential reflectivity data are shown by the color-filled field. Down-range of the heavy rain area, a radially-aligned region of locally reduced <math>Z_{dr}</math> values is apparent. The larger propagation losses experienced by the H waves relative to the V waves during the transit through the oblate raindrops induces this <math>Z_{dr}</math> reduction. Efforts should be made to correct for these differential attenuation effects when quantative use is being made of <math>Z_{dr}</math> data (Bringi et al., JTEC 1990, p. 829). | ||
[[Image:19aug2011 dc kdp anot.png|center]] | [[Image:19aug2011 dc kdp anot.png|center]] | ||
==References== | |||
* Bringi, V. N., V. Chandrasekar, N. Balakrishnan, D. S. Zrnić, 1990: [http://journals.ametsoc.org/doi/abs/10.1175/1520-0426%281990%29007%3C0829%3AAEOPEI%3E2.0.CO%3B2 An Examination of Propagation Effects in Rainfall on Radar Measurements at Microwave Frequencies]. ''J. Atmos. Oceanic Technol.'', '''7''', 829–840. | |||
[[Category:Heavy Rain]] | |||
[[Category:Differential Propagation Phase]] | |||
[[Category:Differential Attenuation]] | |||
[[Category:Featured Articles]] | |||
Latest revision as of 21:28, 1 November 2011

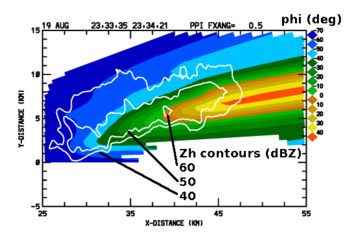
A thunderstorm produced an axis of heavy rain that was positioned along a radial from the CSU-CHILL radar on 19 August 2011. Plots showing the resultant differential attenuation effects on have been prepared.
Introduction
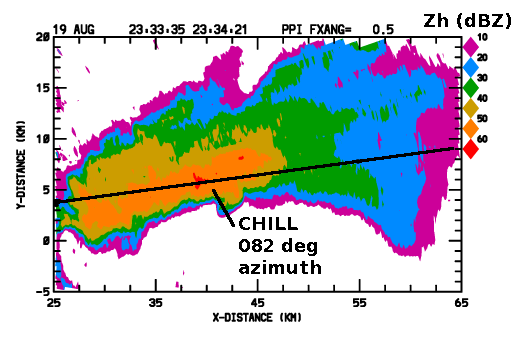
Scattered thunderstorms developed in several portions of the CSU-CHILL coverage area during the afternoon hours of 19 August 2011. For an ~10 minute time period, the storms developing a short distance east of the radar produced an echo pattern with a maximum reflectivity axis that was radially aligned with the radar. Radar pulses propagating along this heavy rain axis experienced the accumulated effects of high concentrations of oblate raindrops: The greater retardation experienced by the H polarized waves relative to the V polarized waves caused large differential propagation phase () shifts to be observed. The oblate drops also made the attenuation losses greater for the H waves than for the V waves. The resultant preferential weakening of the H signal level introduced a negative bias into the Differential Reflectivity ( ) values.These effects are shown in the following plots made from a low elevation PPI scan through the heavy rain area.
Reflectivity
At 2334 UTC the high reflectivity axis was fairly well aligned with the CHILL 082 degree azimuth.

Differential propagation phase ()
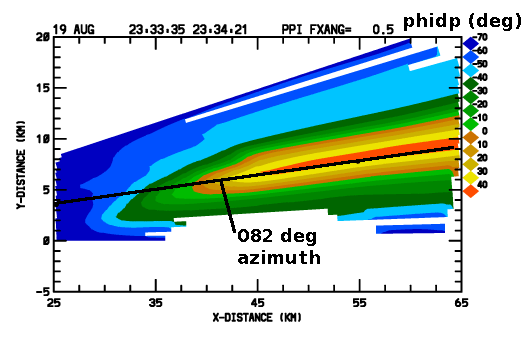
The filtered field for the same PPI sweep is shown in the plot below. The color changes along the 082 degree azimuth indicate a net phase change of ~100 degrees during the transit through the high reflectivity region. (Medium blue (-60 degrees at 28 km range shifting to orange (+40 degrees) at 45 km.) This major increase in the lag of the phase of the received H signal in comparison to the V return implies that a high spatial concentration of oblate raindrops (i.e., intense rain rate) exists along this beam path.

Specific differential propagation phase (Kdp) and differential reflectivity ()
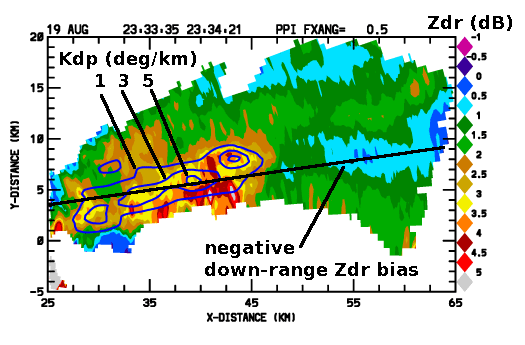
The rate of change of the filtered values per range interval along the radial beam path defines specific differential propagation phase (Kdp). In the following plot, Kdp values are shown as solid blue contour lines. At the CHILL's operating wavelength, the detection of Kdp values in excess of 3 deg / km indicates rain rates in excess of 100 mm / hr. Differential reflectivity data are shown by the color-filled field. Down-range of the heavy rain area, a radially-aligned region of locally reduced values is apparent. The larger propagation losses experienced by the H waves relative to the V waves during the transit through the oblate raindrops induces this reduction. Efforts should be made to correct for these differential attenuation effects when quantative use is being made of data (Bringi et al., JTEC 1990, p. 829).

References
- Bringi, V. N., V. Chandrasekar, N. Balakrishnan, D. S. Zrnić, 1990: An Examination of Propagation Effects in Rainfall on Radar Measurements at Microwave Frequencies. J. Atmos. Oceanic Technol., 7, 829–840.

