Differential Reflectivity from Raindrops and WSR-88D Rainfall Estimation: Difference between revisions
(Initial creation) |
m (Fixed image names) |
||
| Line 1: | Line 1: | ||
Dual polarization weather radars routinely make separate measurements of the strength of the horizontally (H) and vertically (V) polarized components of the received signal. Additional H and V signal properties such as phase and correlation magnitudes are also measured but are not considered here. The ratio of the reflectivity observed at H polarization to that obtained at V polarization is the basis of the differential reflectivity (<math>Z_{dr}</math>) parameter. The received signal strength is related to the scattering particle's dimension in the polarization plane of the radar pulse that is illuminating the particle. The following plot shows a side view of an oblate particle. Since its major diameter lies in the horizontal plane, the H polarization reflectivity will exceed that observed at V polarization. | Dual polarization weather radars routinely make separate measurements of the strength of the horizontally (H) and vertically (V) polarized components of the received signal. Additional H and V signal properties such as phase and correlation magnitudes are also measured but are not considered here. The ratio of the reflectivity observed at H polarization to that obtained at V polarization is the basis of the differential reflectivity (<math>Z_{dr}</math>) parameter. The received signal strength is related to the scattering particle's dimension in the polarization plane of the radar pulse that is illuminating the particle. The following plot shows a side view of an oblate particle. Since its major diameter lies in the horizontal plane, the H polarization reflectivity will exceed that observed at V polarization. | ||
[[Image:zdr_comet_zdr_illustration. | [[Image:zdr_comet_zdr_illustration.gif|thumb|ZDR is the ratio of H to V reflectivity]] | ||
The net forces acting on freely falling raindrops deform them into oblate shapes. These forces vary with the terminal fallspeed of the drops. Large diameter/high terminal velocity drops experience the largest amount of deformation. The following animation steps through the equlibrium shapes (i.e., neglecting the perturbing effects of drop collisions, oscillations, turbulence, etc.) of falling raindrops as their undeformed (spherical) diameter increases from 2 to 6 mm . The steady increase in the horizontal/vertical length axis ratio is apparent. <ref name=beard>Beard and Chuang, JAS 1987</ref> | The net forces acting on freely falling raindrops deform them into oblate shapes. These forces vary with the terminal fallspeed of the drops. Large diameter/high terminal velocity drops experience the largest amount of deformation. The following animation steps through the equlibrium shapes (i.e., neglecting the perturbing effects of drop collisions, oscillations, turbulence, etc.) of falling raindrops as their undeformed (spherical) diameter increases from 2 to 6 mm . The steady increase in the horizontal/vertical length axis ratio is apparent. <ref name=beard>Beard and Chuang, JAS 1987</ref> | ||
[[Image:zdr_comet_zdr_animation. | [[Image:zdr_comet_zdr_animation.gif|thumb|ZDR is proportional to drop size]] | ||
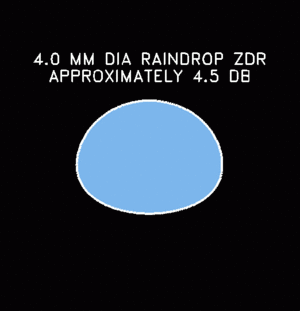
<math>Z_{dr}</math> is defined on a dB scale <math>10\log_{10}(P_{hh}/P_{vv})</math>. Since the logarithm of 1 of 0, <math>Z_{dr}</math> will be 0 dB when the H and V received signal levels are equal. As applied to raindrops, near 0 dB <math>Z_{dr}</math>'s will be associated with small, undeformed, quasi-spherical drops. In contrast, larger mm-sized drops will develop <math>Z_{dr}</math> values of several dB. | <math>Z_{dr}</math> is defined on a dB scale <math>10\log_{10}(P_{hh}/P_{vv})</math>. Since the logarithm of 1 of 0, <math>Z_{dr}</math> will be 0 dB when the H and V received signal levels are equal. As applied to raindrops, near 0 dB <math>Z_{dr}</math>'s will be associated with small, undeformed, quasi-spherical drops. In contrast, larger mm-sized drops will develop <math>Z_{dr}</math> values of several dB. | ||
| Line 11: | Line 11: | ||
{| | {| | ||
|- | |- | ||
|[[Image:zdr_comet_zdr_0dB. | |[[Image:zdr_comet_zdr_0dB.gif|thumb|0.5 mm dia raindrop Zdr is approximately 0dB]] | ||
|[[Image:zdr_comet_zdr_4_5dB. | |[[Image:zdr_comet_zdr_4_5dB.gif|thumb|4.0 mm dia raindrop Zdr is approximately 4.5dB]] | ||
|- | |- | ||
|} | |} | ||
| Line 21: | Line 21: | ||
When convective rain forms in a tropical airmass, the median drop diameter is generally observed to be smaller than the <math>D_0</math> values that are typically found in mid-latitude precipitation. These reduced <math>D_0</math> values imply that a relatively larger fraction of the rain water mass is being carried by the smaller, less oblate drops in tropical rain. The resultant <math>Z_{dr}</math> effects are shown in the following plot. It was constructed using low elevation angle PPI sweeps through convective precipitaton observed in two different climatic areas: The blue curve data were collected by the NCAR S-POL radar while it was deployed to the Caribbean island of Barbuda during the RICO field experiment. The red curve is data recorded by the CSU-CHILL radar near Greeley, Colorado. (Both radars are dual polarization systems operating at S-Band). The curves were generated by averaging the <math>Z_{dr}</math> values observed in 5 dB wide reflectivity bins (i.e., 10 - 15 dBZ, 15 - 20 dBZ, etc.) Even at relatively high reflectivity levels, the <math>Z_{dr}</math> values remain relatively low in the "small drop" tropical environment sampled by SPOL. | When convective rain forms in a tropical airmass, the median drop diameter is generally observed to be smaller than the <math>D_0</math> values that are typically found in mid-latitude precipitation. These reduced <math>D_0</math> values imply that a relatively larger fraction of the rain water mass is being carried by the smaller, less oblate drops in tropical rain. The resultant <math>Z_{dr}</math> effects are shown in the following plot. It was constructed using low elevation angle PPI sweeps through convective precipitaton observed in two different climatic areas: The blue curve data were collected by the NCAR S-POL radar while it was deployed to the Caribbean island of Barbuda during the RICO field experiment. The red curve is data recorded by the CSU-CHILL radar near Greeley, Colorado. (Both radars are dual polarization systems operating at S-Band). The curves were generated by averaging the <math>Z_{dr}</math> values observed in 5 dB wide reflectivity bins (i.e., 10 - 15 dBZ, 15 - 20 dBZ, etc.) Even at relatively high reflectivity levels, the <math>Z_{dr}</math> values remain relatively low in the "small drop" tropical environment sampled by SPOL. | ||
[[Image:zdr_comet_avgzdr|thumb|Average Rain Zdr Values in 5dB Wide Reflectivity Bins]] | [[Image:zdr_comet_avgzdr.png|thumb|Average Rain Zdr Values in 5dB Wide Reflectivity Bins]] | ||
Since the conventional (single polarization) radar reflectivity factor is strongly correlated with the diameter of the scattering particles, reflectivity values will tend to be reduced in tropical/small raindrop size situations. Under these conditions, the standard operational methods of estimating rain rate from reflectivity values alone can suffer from accuracy reductions. | Since the conventional (single polarization) radar reflectivity factor is strongly correlated with the diameter of the scattering particles, reflectivity values will tend to be reduced in tropical/small raindrop size situations. Under these conditions, the standard operational methods of estimating rain rate from reflectivity values alone can suffer from accuracy reductions. | ||
| Line 49: | Line 49: | ||
|- | |- | ||
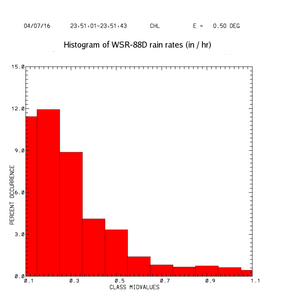
|[[Image:zdr_comet_rr_hist_nws.png|thumb|Histogram of rain rate, as computed with WSR-88D algorithm]] | |[[Image:zdr_comet_rr_hist_nws.png|thumb|Histogram of rain rate, as computed with WSR-88D algorithm]] | ||
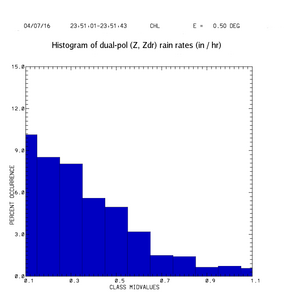
|[[Image: | |[[Image:zdr_comet_rr_hist_zdr.png|thumb|Histogram of rain rate, computed with Z,Zdr algorithm]] | ||
|- | |- | ||
|} | |} | ||
| Line 55: | Line 55: | ||
The final plot shown below alternates between the above two histogram plots. It can be seen that the spectrum of rain rates calculated by the polarimetric method (blue) includes more occurrances of higher rain rate values. Especially during multi-hour rain episodes, these instantenous rate differences can integrate into appreciable changes in the total storm accumulation. (For example, see the analysis of the Fort Collins Colorado flash flood event of 28 July 1997 presented in the Feb 1999 issue of BAMS.) | The final plot shown below alternates between the above two histogram plots. It can be seen that the spectrum of rain rates calculated by the polarimetric method (blue) includes more occurrances of higher rain rate values. Especially during multi-hour rain episodes, these instantenous rate differences can integrate into appreciable changes in the total storm accumulation. (For example, see the analysis of the Fort Collins Colorado flash flood event of 28 July 1997 presented in the Feb 1999 issue of BAMS.) | ||
[[Image:zdr_comet_histogram_combined|thumb|Histogram of rain rate, alternating between WSR-88D algorithm (red) and dual-pol algorithm (blue)]] | [[Image:zdr_comet_histogram_combined.gif|thumb|Histogram of rain rate, alternating between WSR-88D algorithm (red) and dual-pol algorithm (blue)]] | ||
Finally, it should be noted that the <math>Z</math>,<math>Z_{dr}</math> estimator is only one method of using dual polarization radar data to calculate rain rates. Other estimators based on changes in the phase difference measured between the H and V signal returns are also quite useful, especially when the precipitation contains hail. | Finally, it should be noted that the <math>Z</math>,<math>Z_{dr}</math> estimator is only one method of using dual polarization radar data to calculate rain rates. Other estimators based on changes in the phase difference measured between the H and V signal returns are also quite useful, especially when the precipitation contains hail. | ||
Revision as of 14:10, 25 August 2008
Dual polarization weather radars routinely make separate measurements of the strength of the horizontally (H) and vertically (V) polarized components of the received signal. Additional H and V signal properties such as phase and correlation magnitudes are also measured but are not considered here. The ratio of the reflectivity observed at H polarization to that obtained at V polarization is the basis of the differential reflectivity () parameter. The received signal strength is related to the scattering particle's dimension in the polarization plane of the radar pulse that is illuminating the particle. The following plot shows a side view of an oblate particle. Since its major diameter lies in the horizontal plane, the H polarization reflectivity will exceed that observed at V polarization.

The net forces acting on freely falling raindrops deform them into oblate shapes. These forces vary with the terminal fallspeed of the drops. Large diameter/high terminal velocity drops experience the largest amount of deformation. The following animation steps through the equlibrium shapes (i.e., neglecting the perturbing effects of drop collisions, oscillations, turbulence, etc.) of falling raindrops as their undeformed (spherical) diameter increases from 2 to 6 mm . The steady increase in the horizontal/vertical length axis ratio is apparent. [1]

is defined on a dB scale . Since the logarithm of 1 of 0, will be 0 dB when the H and V received signal levels are equal. As applied to raindrops, near 0 dB 's will be associated with small, undeformed, quasi-spherical drops. In contrast, larger mm-sized drops will develop values of several dB.
 |
 |
When weather radars observe rain echoes, the received signal is obtained from sampling volumes that almost always contain a spectrum of drop sizes. Under these conditions, the value represents the reflectivity-weighted mean axis ratio of all of the drops in the pulse volume [2] Also, as originally shown by [3], the obtained from rain can be used to characterize the median diameter () of the drop size distribution. (The median diameter divides the total rainwater mass into two equal halves.)
When convective rain forms in a tropical airmass, the median drop diameter is generally observed to be smaller than the values that are typically found in mid-latitude precipitation. These reduced values imply that a relatively larger fraction of the rain water mass is being carried by the smaller, less oblate drops in tropical rain. The resultant effects are shown in the following plot. It was constructed using low elevation angle PPI sweeps through convective precipitaton observed in two different climatic areas: The blue curve data were collected by the NCAR S-POL radar while it was deployed to the Caribbean island of Barbuda during the RICO field experiment. The red curve is data recorded by the CSU-CHILL radar near Greeley, Colorado. (Both radars are dual polarization systems operating at S-Band). The curves were generated by averaging the values observed in 5 dB wide reflectivity bins (i.e., 10 - 15 dBZ, 15 - 20 dBZ, etc.) Even at relatively high reflectivity levels, the values remain relatively low in the "small drop" tropical environment sampled by SPOL.

Since the conventional (single polarization) radar reflectivity factor is strongly correlated with the diameter of the scattering particles, reflectivity values will tend to be reduced in tropical/small raindrop size situations. Under these conditions, the standard operational methods of estimating rain rate from reflectivity values alone can suffer from accuracy reductions.
CSU-CHILL Radar Observations from 16 July 2004
An example of this situation occurred during the evening hours of 16 July, 2004. The relevant forecast discussion issued by the Boulder NWS office made mention of the existence of a warm rain (i.e., tropical-type sounding) environment. Some of the evening's convection was being observed through PPI sector scans made by the CSU-CHILL research radar. The plot below shows the conventional reflectivity data observed in a single 0.5° elevation angle sector scan:
The following plot shows the rain rates (in inches/hour) calculated calculated from the reflectivity data. The formula used for this calculation matches that used by the NWS with their WSR-88D radars:
A dual polarization rain rate estimate using both reflectivity and data from the same PPI sweep can be calculated. The rate formula was taken from Eq. 8.12b in [4]
Where is rain rate (mm/hr), is linear scale reflectivity (), and is differential reflectivity in dB
Since appears in the denominator of this expression; reductions in will result in increased rain rates. The following plot shows how the inclusion of information in this warm rain situation generally increases the rain rates relative to those calculated using the conventional WSR-88D method.
An alternative view of these results is provided by histograms of the rain rates produced by the conventional WSR-88D method and by the combined Z, method. In the following two plots, the WSR-88D rate histogram is shown in red and the polarimetric histogram is in blue.
 |
 |
The final plot shown below alternates between the above two histogram plots. It can be seen that the spectrum of rain rates calculated by the polarimetric method (blue) includes more occurrances of higher rain rate values. Especially during multi-hour rain episodes, these instantenous rate differences can integrate into appreciable changes in the total storm accumulation. (For example, see the analysis of the Fort Collins Colorado flash flood event of 28 July 1997 presented in the Feb 1999 issue of BAMS.)

Finally, it should be noted that the , estimator is only one method of using dual polarization radar data to calculate rain rates. Other estimators based on changes in the phase difference measured between the H and V signal returns are also quite useful, especially when the precipitation contains hail.


