Damaging hailstorm at Cheyenne, WY: 12 July 2011: Difference between revisions
Pat kennedy (talk | contribs) No edit summary |
Pat kennedy (talk | contribs) No edit summary |
||
| Line 1: | Line 1: | ||
==Introduction== | |||
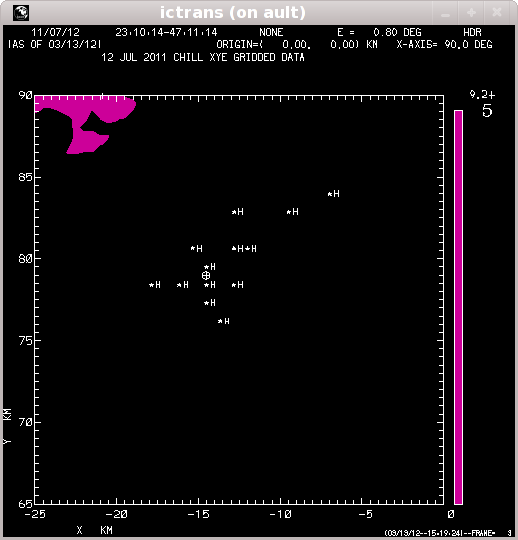
During the month of July, 2011 the large scale monsoon circulation significantly increased the mean tropospheric water vapor content in the Colorado - Wyoming area. At an early point in this monsoon flow period, a severe thunderstorm that produced widespread hail damage and localized flooding struck the city of Cheyenne Wyoming on 12 July. While this event took place, the CSU-CHILL radar scanning was primarily focused on additional convective precipitation falling over the foothills of Boulder County. Single elevation 360 degree PPI scans were also being done at ~5 minute intervals. The data plots shown in this article were developed from these 0.8 degree elevation surveillance scans. The following figure identifies some VCHILL base map features in the Cheyenne (CYS) area. The plus symbols mark locations of the XX hail reports in the Storm Prediction Center files that were associated with this event. Hailstone diameters up to 2 inches were reported along with many instances of roof and window damage. (Since individual spotters sometime filed more than one report from a single location, fewer than XX reports are plotted). | |||
[[Image:VCHILL base 75 90 anot.png|center]] | [[Image:VCHILL base 75 90 anot.png|center]] | ||
==Reflectivity loop== | ==Reflectivity loop== | ||
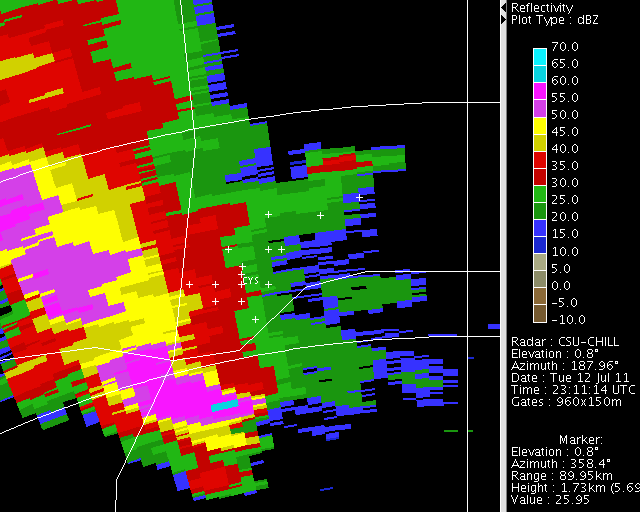
The primary echo core crossed the city while moving from the south-southwest. Due to the large backscattering cross sections of the hailstones, reflectivity levels reach ~70 dBZ. | |||
<center> | <center> | ||
<imgloop delay=300 imgprefix="http://www.chill.colostate.edu/anim/april_2012_CYS_hail_web/" width=640 height=512> | <imgloop delay=300 imgprefix="http://www.chill.colostate.edu/anim/april_2012_CYS_hail_web/" width=640 height=512> | ||
| Line 18: | Line 23: | ||
==Differential reflectivity loop== | ==Differential reflectivity loop== | ||
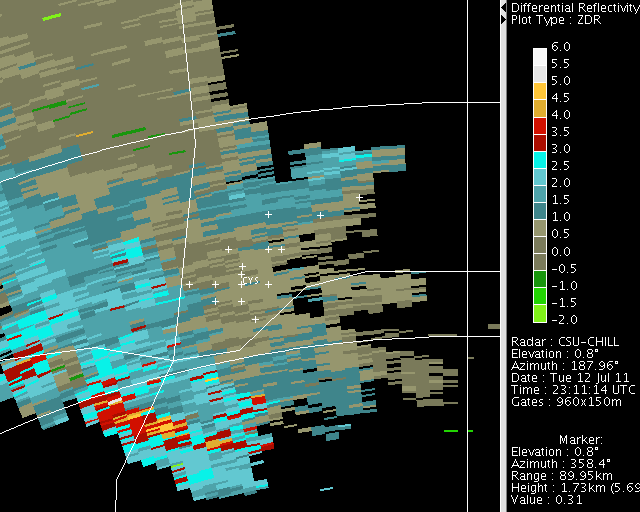
The presence of many quasi-spherical, tumbling hailstones tended to equalize the co-polar signal levels received at horizontal and vertical polarizations. Since differential reflectivity (Zdr) is based on the logarithm of the (H/V) received power ratio, Zdr decreased to ~0 dB in much of the high reflectivity core area. In some sweeps, negative Zdr values (V power > H power) occurred. Negative Zdr values have been observed in other instances of large hail (Balki and Zrnic ref) | |||
<center> | <center> | ||
<imgloop delay=300 imgprefix="http://www.chill.colostate.edu/anim/april_2012_CYS_hail_web/" width=640 height=512> | <imgloop delay=300 imgprefix="http://www.chill.colostate.edu/anim/april_2012_CYS_hail_web/" width=640 height=512> | ||
| Line 34: | Line 41: | ||
==Hail differential reflectivity (Hdr) loop== | ==Hail differential reflectivity (Hdr) loop== | ||
Aydin et al (JAM 1986) developed the Hail Differential Reflectivity parameter (Hdr) to exploit the high reflectivity / low Zdr combination that distinguishes hail echoes from those due oblate raindrops. Positive Hdr values are associated with the existence of hail. The following Hdr loops shows that distinctly positive Hdr values swept across most of the SPC hail reports. | |||
<center> | <center> | ||
<imgloop delay=300 imgprefix="http://www.chill.colostate.edu/anim/april_2012_CYS_hail_web/" width=518 height=540> | <imgloop delay=300 imgprefix="http://www.chill.colostate.edu/anim/april_2012_CYS_hail_web/" width=518 height=540> | ||
| Line 49: | Line 58: | ||
</center> | </center> | ||
==Cross-Correlation and Linear Depolarization Ratio Data== | |||
The following four panel plot was generated using the NCAR SOLO program. Reflectivity and Zdr are shown in the upper two panels; reflectivity maximized in this sweep. The irregular boundary encloses the high reflectivity / low Zdr hail area. The rhoHV and Linear Depolarization characteristics of this same area are shown in the lower two panels. | |||
[[Image:12jul2011 CYS SOLO hail anot.png|center]] | [[Image:12jul2011 CYS SOLO hail anot.png|center]] | ||
Revision as of 05:51, 30 March 2012
Introduction
During the month of July, 2011 the large scale monsoon circulation significantly increased the mean tropospheric water vapor content in the Colorado - Wyoming area. At an early point in this monsoon flow period, a severe thunderstorm that produced widespread hail damage and localized flooding struck the city of Cheyenne Wyoming on 12 July. While this event took place, the CSU-CHILL radar scanning was primarily focused on additional convective precipitation falling over the foothills of Boulder County. Single elevation 360 degree PPI scans were also being done at ~5 minute intervals. The data plots shown in this article were developed from these 0.8 degree elevation surveillance scans. The following figure identifies some VCHILL base map features in the Cheyenne (CYS) area. The plus symbols mark locations of the XX hail reports in the Storm Prediction Center files that were associated with this event. Hailstone diameters up to 2 inches were reported along with many instances of roof and window damage. (Since individual spotters sometime filed more than one report from a single location, fewer than XX reports are plotted).

Reflectivity loop
The primary echo core crossed the city while moving from the south-southwest. Due to the large backscattering cross sections of the hailstones, reflectivity levels reach ~70 dBZ.
|
|
||
|
Differential reflectivity loop
The presence of many quasi-spherical, tumbling hailstones tended to equalize the co-polar signal levels received at horizontal and vertical polarizations. Since differential reflectivity (Zdr) is based on the logarithm of the (H/V) received power ratio, Zdr decreased to ~0 dB in much of the high reflectivity core area. In some sweeps, negative Zdr values (V power > H power) occurred. Negative Zdr values have been observed in other instances of large hail (Balki and Zrnic ref)
|
|
||
|
Hail differential reflectivity (Hdr) loop
Aydin et al (JAM 1986) developed the Hail Differential Reflectivity parameter (Hdr) to exploit the high reflectivity / low Zdr combination that distinguishes hail echoes from those due oblate raindrops. Positive Hdr values are associated with the existence of hail. The following Hdr loops shows that distinctly positive Hdr values swept across most of the SPC hail reports.
|
|
||
|
Cross-Correlation and Linear Depolarization Ratio Data
The following four panel plot was generated using the NCAR SOLO program. Reflectivity and Zdr are shown in the upper two panels; reflectivity maximized in this sweep. The irregular boundary encloses the high reflectivity / low Zdr hail area. The rhoHV and Linear Depolarization characteristics of this same area are shown in the lower two panels.
