DPWX/Varying thunderstorm Zdr patterns: 13 June 2016
From CSU-CHILL

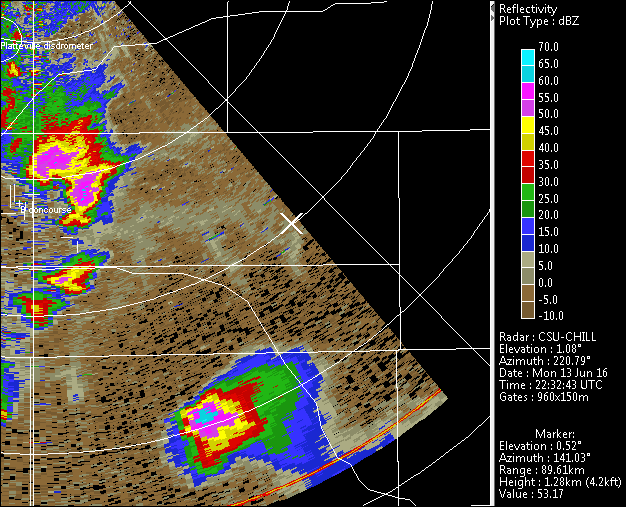
S-band reflectivity loop.
|
|
||
|
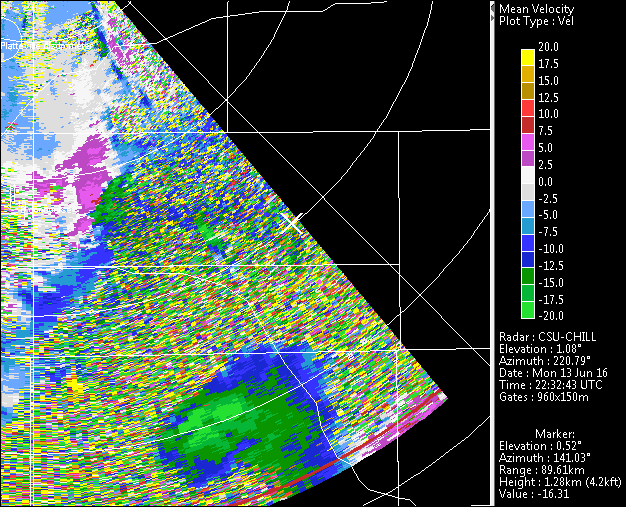
S-band radial velocity loop
|
|
||
|
S-Band RHI data at 2305 UTC containing both storms


2305 UTC RHI xoomed in on the 60 km storm; X-band rhoHV overlay on S-Band data:


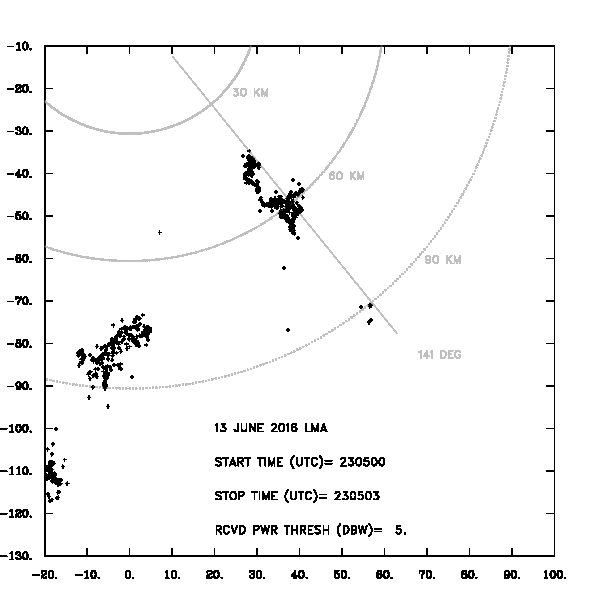
LMA data in 3 second time intervals for the minutes of 2305 and 2306 UTC on 13 June 2016.
|
|
||
|