DPWX/Variations in snow crystal riming and Zdr: 26 - 27 November 2015: Difference between revisions
Pat kennedy (talk | contribs) No edit summary |
Pat kennedy (talk | contribs) No edit summary |
||
| Line 6: | Line 6: | ||
[[Image:Fig mt PCK 1 CHILL web article Mar 2016.png|center]] | [[Image:Fig mt PCK 1 CHILL web article Mar 2016.png|center]] | ||
The | The next plot gives a summary of the time period of interest. The top panel shows the excellent correspondence between the POSS reflectivity values (red trace) and the CSU-CHILL X-band reflectivity values that were extracted from low elevation angle PPI scans over Easton. The middle panel shows the corresponding CSU-CHILL differential reflectivity (Zdr) measurements. The Zdr values were near 0 dB during the early period (~18 - 20 UTC on 26 November). A different regime in which Zdr was consistently near +2 dB took place in the 03 - 04 UTC time interval on 27 November. Examinations of the MASC particle images indicated that riming on the snow particles was more evident during the early, low Zdr period. The two contrasting Zdr episodes of interest have been marked along with the Easton site air temperature traces shown in the bottom figure panel. | ||
[[Image:Fig mt 2 CHILL web article Mar 2016.png|center]] | [[Image:Fig mt 2 CHILL web article Mar 2016.png|center]] | ||
| Line 13: | Line 13: | ||
[[Image:Z Zdr regimes.png|640px|center]] | [[Image:Z Zdr regimes.png|640px|center]] | ||
Loops assembled from the MASC images were prepared to show the differences in the degree of riming between the two Zdr regimes. Based on the scatter plot shown above, the Zdr characteristics between the two time periods were quite different when the reflectivity was ~ 5 dBZ. MASC images were examined from two times (1900-1909 UTC and 0303-0314 UTC). The first ~15 visually distinct images were selected in each time period. Note that in some cases the images are of the same snow particle seen by different cameras. The snow crystals seen in the earlier, low Zdr period (coded purple in the scatter plot) are typically rimed. The general degree of aggregation is not pronounced, with most of the particles apparently composed of only a few individual crystals. | |||
<center> | <center> | ||
| Line 34: | Line 36: | ||
</center> | </center> | ||
During the later, positive Zdr period (03 - 04 UTC on 27 November; orange scatterplot points), the minimal amount of riming allows the small scale details of the ice crystal structures to become more evident. | |||
<center> | <center> | ||
| Line 59: | Line 60: | ||
==26 Nov 2015 1723 to 2010 UTC X-band Zh (rimed crystals) | ==RHI scan image loops== | ||
26 Nov 2015 1723 to 2010 UTC X-band Zh (rimed crystals) | |||
Reflectivities reach 14 dBZ (red) at various times, especially near the surface. In general the height gradient of reflectivity is larger than in the evening, pristine crystal period (see next loop series). | Reflectivities reach 14 dBZ (red) at various times, especially near the surface. In general the height gradient of reflectivity is larger than in the evening, pristine crystal period (see next loop series). | ||
| Line 123: | Line 125: | ||
</center> | </center> | ||
Purple period Zdr | |||
Note minimal Zdr variations at the surface at Easton during ~ -7 to +15 dBZ Zh variations. This gives the "flat", fairly constant Zdr pattern in the purple (daytime) points of the Zdr vs. Zh scatterplots. | Note minimal Zdr variations at the surface at Easton during ~ -7 to +15 dBZ Zh variations. This gives the "flat", fairly constant Zdr pattern in the purple (daytime) points of the Zdr vs. Zh scatterplots. | ||
| Line 188: | Line 190: | ||
27 Nov 2015 0200 to 0408 UTC X-band Zh (pristine crystals) | |||
Compared to the daytime period loop, the echo depth is slightly deeper, but maximum reflectivity levels, and consequently height gradient of reflectivity, are reduced from their daytime period values. | Compared to the daytime period loop, the echo depth is slightly deeper, but maximum reflectivity levels, and consequently height gradient of reflectivity, are reduced from their daytime period values. | ||
| Line 241: | Line 243: | ||
27 Nov 2015 0200 to 0408 UTC X-band Zdr (pristine crystals) | |||
Unlike the morning (purple) period, Zdr varies inversely with Zh. This gives the "angled" appearance to the orange points in the scatterplot. | Unlike the morning (purple) period, Zdr varies inversely with Zh. This gives the "angled" appearance to the orange points in the scatterplot. | ||
| Line 294: | Line 296: | ||
</center> | </center> | ||
==POSS data== | |||
== | Recently Doppler spectral modal analysis has been developed for POSS measurements by EC (B. E. Sheppard, D. Hudak, P. Rodriguez, private communication). This calculates the modal values of each of the 960 power spectra that are collected per minute. To a first order, these modal values of power and Doppler velocity reflect the characteristics of the scatterers detected closest to the center of the sample volume. These characteristics are then be classified into various habit or particle types through physical forward modeling that take into consideration specific wind conditions and hydrometeor mass, density, phase, and shape. The methodology utilizes the number of modal occurrences in a specified power interval, at each Doppler frequency interval. The particle types that can be identified are rain, drizzle, and for solid particles stellar, irregular, aggregates, graupel and ice pellets. | ||
The output of such analysis is given below (top panel) as time series for the 27 Nov 2015 case. The percentage of particles classified as ‘stellar’ are shown as black shaded area. The bottom panel shows the CHILL X-band Zdr for the same time period. One can see excellent correlation between the percentage of particles classified as stellar and the X-band Zdr, particularly the rise and fall between 0300 and 0400 UTC. It was during this period that MASC recorded significant amount of pristine dendritic crystals, which as mentioned before, will tend to fall in order to maximize the drag. | |||
[[Image:Fig mt 4 CHILL web article Mar 2016.png|600px|center]] | |||
Finally, the fall velocities derived from POSS for the two time periods also show different characteristics. The left panel of the figure below compares the histograms of the mean velocities derived from the Doppler spectra over 1-minute for the two time periods. The corresponding standard deviations are compared in term of the 0th moment in the right-hand panel. The stellar dominated event shows lower mean velocities and larger standard deviations compared with the more rimed snow event, hence implying that stellar crystals not only experience more drag due to the horizontal alignment but also tend to have more irregular movement (“flutter”) as they fall. | |||
[[Image: | [[Image:Fig mt 5 CHILL web article Mar 2016.png|660px|center]] | ||
Revision as of 15:14, 17 February 2016
Overview
Data collection for the Multi-Angle Snowflake Camera and Radar project continued for a second cold season during the winter of 2015 - 2016. An overview of the hydrometeor-observing instrumentation installed at the Easton Valley View airport is available here. One significant change made during the current MASCRAD data collection season is the use of the dual frequency (S and X-band) CSU-CHILL radar configuration. The narrow (0.3 degree) X-band beam width allows radar data to be collected at Easton at heights as low as 180 m above ground level without being affected by ground clutter. For the current winter season, a Precipitation Occurrence Sensor System (POSS; Sheppard and Joe, 2008) has been also added to the Easton site. The POSS is a small, vertically pointing X-band bi-static radar system that allows Doppler velocity power spectra to be developed from precipitating hydrometeors. The POSS contributed useful observations during an episode of light snow on 26 - 27 November 2015 during which notable Zdr variations took place.
The following image shows some of the instrumentation that is currently installed at the Easton site. The POSS transmit/receive units have been installed on top of a wooden pole attached to the outer fence of the wind screen.

The next plot gives a summary of the time period of interest. The top panel shows the excellent correspondence between the POSS reflectivity values (red trace) and the CSU-CHILL X-band reflectivity values that were extracted from low elevation angle PPI scans over Easton. The middle panel shows the corresponding CSU-CHILL differential reflectivity (Zdr) measurements. The Zdr values were near 0 dB during the early period (~18 - 20 UTC on 26 November). A different regime in which Zdr was consistently near +2 dB took place in the 03 - 04 UTC time interval on 27 November. Examinations of the MASC particle images indicated that riming on the snow particles was more evident during the early, low Zdr period. The two contrasting Zdr episodes of interest have been marked along with the Easton site air temperature traces shown in the bottom figure panel.

Another view of the two contrasting Zdr periods is shown in the following Zh vs. Zdr scatter plot constructed from the CHILL X-band data. During the early, low Zdr (purple color code) period, Zdr remained near 0 dB despite Zh variations of ~15 dB. In the later, high Zdr (orange color code) period, tended to become more positive as Zh decreased.

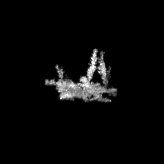
Loops assembled from the MASC images were prepared to show the differences in the degree of riming between the two Zdr regimes. Based on the scatter plot shown above, the Zdr characteristics between the two time periods were quite different when the reflectivity was ~ 5 dBZ. MASC images were examined from two times (1900-1909 UTC and 0303-0314 UTC). The first ~15 visually distinct images were selected in each time period. Note that in some cases the images are of the same snow particle seen by different cameras. The snow crystals seen in the earlier, low Zdr period (coded purple in the scatter plot) are typically rimed. The general degree of aggregation is not pronounced, with most of the particles apparently composed of only a few individual crystals.
|
|
||
|
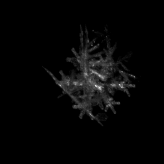
During the later, positive Zdr period (03 - 04 UTC on 27 November; orange scatterplot points), the minimal amount of riming allows the small scale details of the ice crystal structures to become more evident.
|
|
||
|
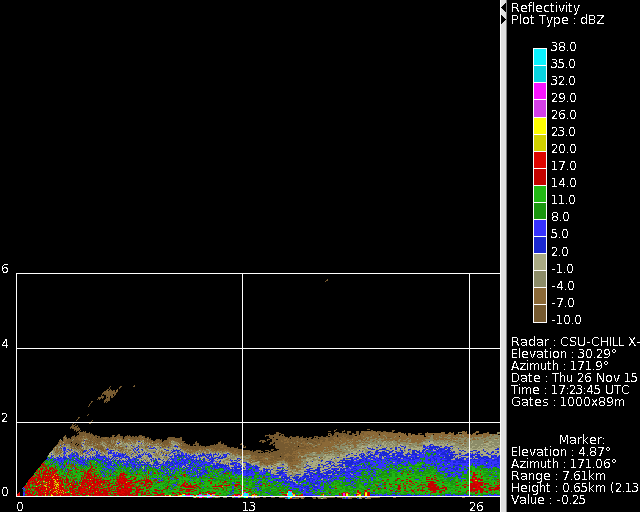
RHI scan image loops
26 Nov 2015 1723 to 2010 UTC X-band Zh (rimed crystals) Reflectivities reach 14 dBZ (red) at various times, especially near the surface. In general the height gradient of reflectivity is larger than in the evening, pristine crystal period (see next loop series).
|
|
||
|
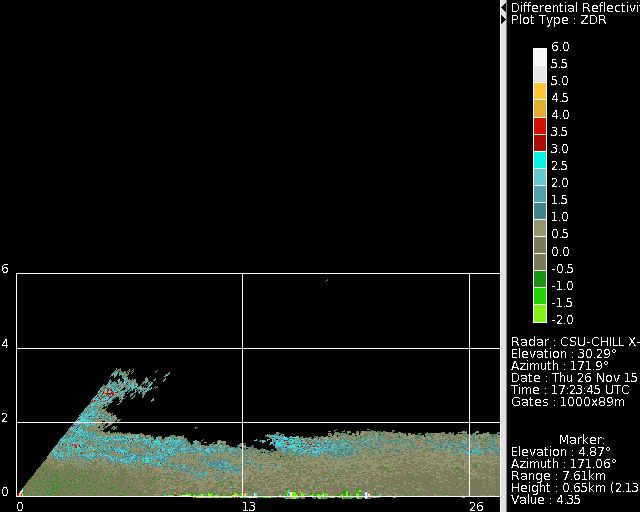
Purple period Zdr Note minimal Zdr variations at the surface at Easton during ~ -7 to +15 dBZ Zh variations. This gives the "flat", fairly constant Zdr pattern in the purple (daytime) points of the Zdr vs. Zh scatterplots.
|
|
||
|
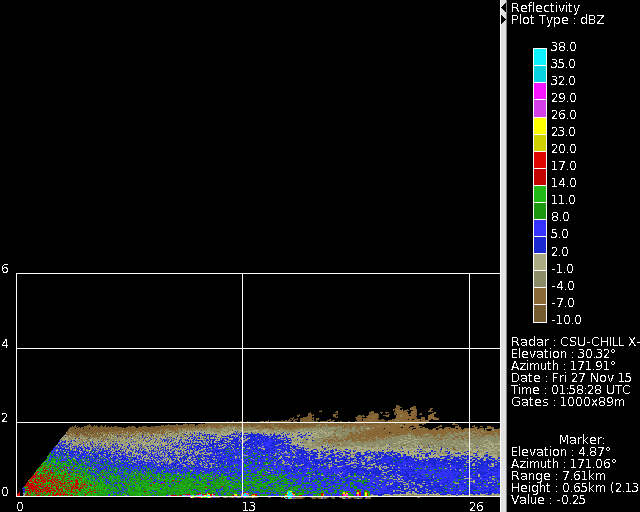
27 Nov 2015 0200 to 0408 UTC X-band Zh (pristine crystals)
Compared to the daytime period loop, the echo depth is slightly deeper, but maximum reflectivity levels, and consequently height gradient of reflectivity, are reduced from their daytime period values.
|
|
||
|
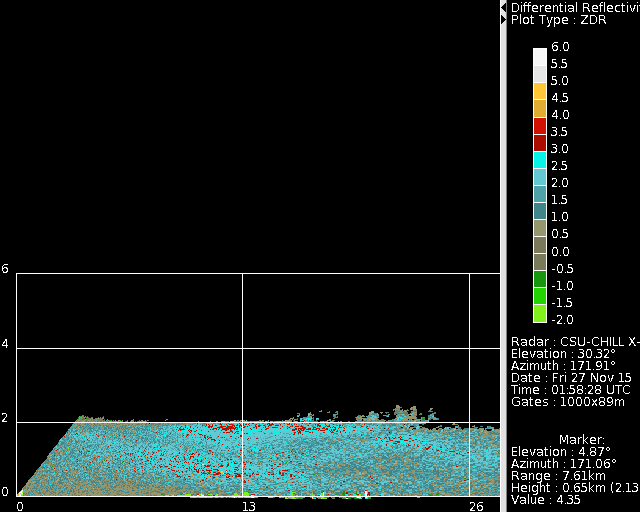
27 Nov 2015 0200 to 0408 UTC X-band Zdr (pristine crystals)
Unlike the morning (purple) period, Zdr varies inversely with Zh. This gives the "angled" appearance to the orange points in the scatterplot.
|
|
||
|
POSS data
Recently Doppler spectral modal analysis has been developed for POSS measurements by EC (B. E. Sheppard, D. Hudak, P. Rodriguez, private communication). This calculates the modal values of each of the 960 power spectra that are collected per minute. To a first order, these modal values of power and Doppler velocity reflect the characteristics of the scatterers detected closest to the center of the sample volume. These characteristics are then be classified into various habit or particle types through physical forward modeling that take into consideration specific wind conditions and hydrometeor mass, density, phase, and shape. The methodology utilizes the number of modal occurrences in a specified power interval, at each Doppler frequency interval. The particle types that can be identified are rain, drizzle, and for solid particles stellar, irregular, aggregates, graupel and ice pellets. The output of such analysis is given below (top panel) as time series for the 27 Nov 2015 case. The percentage of particles classified as ‘stellar’ are shown as black shaded area. The bottom panel shows the CHILL X-band Zdr for the same time period. One can see excellent correlation between the percentage of particles classified as stellar and the X-band Zdr, particularly the rise and fall between 0300 and 0400 UTC. It was during this period that MASC recorded significant amount of pristine dendritic crystals, which as mentioned before, will tend to fall in order to maximize the drag.

Finally, the fall velocities derived from POSS for the two time periods also show different characteristics. The left panel of the figure below compares the histograms of the mean velocities derived from the Doppler spectra over 1-minute for the two time periods. The corresponding standard deviations are compared in term of the 0th moment in the right-hand panel. The stellar dominated event shows lower mean velocities and larger standard deviations compared with the more rimed snow event, hence implying that stellar crystals not only experience more drag due to the horizontal alignment but also tend to have more irregular movement (“flutter”) as they fall.
