DPWX/Tornadic supercell thunderstorm on 7 May 2016: Dual polarization parameters and their evolution: Difference between revisions
Pat kennedy (talk | contribs) (First 3 images converted into a loop.) |
Pat kennedy (talk | contribs) (Initial cut and paste of UNC text.) |
||
| Line 1: | Line 1: | ||
Authors: Nathan B. Deuschle and Dr. Wendilyn Flynn, University of Northern Colorado | |||
==Overview== | ==Overview== | ||
This article presents an analysis of dual polarization parameters and their evolution during a tornadic supercell thunderstorm that occurred on May 7th, 2016 near the town of Wiggins, Colorado. The presence of a strong mesocyclone was established in an '''[[ DPWX//Tornadic_supercell_thunderstorm:_7_May_2016 |earlier analysis]]''' of Doppler velocities. | |||
==Arcs of high differential reflectivity (Zdr)== | |||
<center> | <center> | ||
| Line 9: | Line 15: | ||
</center> | </center> | ||
An interesting low-level ZDR signature known as the ZDR arc (Kumjian and Ryzhkov 2009, 2012) is observed within the above loop of ZH and ZDR from 20:54 UTC to 21:03 UTC. The ZDR arc can be seen where the white dashed lines are located starting to the southeast of Orchard. High ZDR values between 1.0 and 4.0 dB are observed within the arc, which exists along the eastern side of the forward flank downdraft of this storm. The ZDR arc forms as a result of size sorting of the hydrometeors on their descent due to vertical wind shear (Kumjian and Ryzhkov 2009, 2012). Larger hydrometeors fall out along the inflow edge of the forward flank downdraft, while smaller hydrometeors are transported further downstream. As a result of the size sorting, higher KDP values can be observed to the left of the ZDR arc. This can be seen in the images of KDP and ZDR below. A separate, secondary arc of enhanced ZDR is also observed, indicated by the white dashed lines that start just to the west of Wiggins. Low values of the correlation coefficient (HV) within this zone suggest that this arc of high ZDR is associated with the rear flank downdraft gust front. | |||
==Horizontal Reflectivity, Differential Reflectivity, and Specific Differential Propagation Phase Analysis== | |||
| Line 21: | Line 30: | ||
[[Image:KDP HookEcho 2103Z.png|center]] | [[Image:KDP HookEcho 2103Z.png|center]] | ||
Above are plots of horizontal reflectivity (ZH), differential reflectivity (ZDR), and specific differential propagation phase (KDP) at 21:03 UTC when a well-defined hook echo was present, and tornado was confirmed according to the SPC severe weather [http://www.spc.noaa.gov/exper/archive/event.php?date=20160507 archive]. Local reservoirs, highways, and towns are overlaid. | |||
To the south of the marker and over Empire Reservoir, ZDR values are in the range of 0 to -2 dB, KDP values are around .82 to 1.91 deg/km, and ZH values are above 60 dBZ. The combination of these parameters suggests the presence of large hail in this region of the rear flank downdraft. North/northeast of Masters and over the Riverside Reservoir we see a bull’s-eye of high KDP values ~3.0 deg/km, with ZDR values 0 to 0.5 dB, and ZH values of above 60 dBZ. This would indicate that melting hail is falling in this part of the forward flank downdraft. To the north and west of Masters, ZDR values are much larger, around 4.0 dB, also coinciding with high horizontal reflectivities (ZH) and high KDP values, indicating that large, oblate raindrops are falling in this area of the forward flank downdraft. | |||
==Evidence of debris== | ==Evidence of debris== | ||
[[Image:RHOHV Debris 2103Z.png|center]] | [[Image:RHOHV Debris 2103Z.png|center]] | ||
When looking at the above snapshot of the correlation coefficient (HV) at 21:03 UTC, evidence of debris can be seen in the vicinity of the hook echo (marked at the X). HV values below 0.8 exist at the marker, which indicates that these are non-meteorological targets. This corresponds with where we expect the tornado to be located when looking at the hook echo in the ZH image and the tornado vortex signature in a velocity image. The earlier Doppler '''[[ DPWX//Tornadic_supercell_thunderstorm:_7_May_2016 |analysis]]''' contained a velocity couplet observed from CHILL and KFTG. Large, negative values of ZDR are seen in this area as well, which also points to the presence of debris, as negative ZDR values indicate a larger vertical than horizontal orientation of a target. The NWS damage [http://www.weather.gov/bou/nwsDamageSurvey_050716 survey] documented instances of large trees blown over, damage to trailers near Empire Reservoir, and power lines toppled with this event, so it is reasonable to conclude that debris was lofted with this circulation. | |||
==Evidence of | ==Evidence of Biological Targets/Gust Front and Second Tornado== | ||
| Line 45: | Line 57: | ||
[[Image:ZDR RHI BioTargets 2149Z.png|center]] | [[Image:ZDR RHI BioTargets 2149Z.png|center]] | ||
At 21:41 UTC, this supercell has progressed northward into Weld County. Another arc of high ZDR values (~4.0 dB) and low HV values (<0.8) appears, which indicates that biological or non-meteorological targets are detected here. The RHI scan below from 21:49 UTC and the images above show that this arc of high ZDR and low HV is along the leading edge of a gust front. The marker in the RHI scan is located where the enhanced ZDR values are located, just ahead of the highest reflectivities, where we would expect an outflow boundary or gust front. This gust front appears to link the circulation in our supercellular storm with another circulation marked near the X in the above image. This circulation was documented in the NWS damage [http://www.weather.gov/bou/nwsDamageSurvey_050716 survey] as a separate tornado | |||
==Summary== | ==Summary== | ||
The tornadic supercell thunderstorm that occurred on May 7th 2016 near the town of Wiggins, Colorado exhibited many interesting features when looking at the evolution of the dual polarization parameters. Many different sizes and types of hydrometeors (and non-hydrometeors) can be determined when analyzing ZH, KDP, and ZDR together. While a distinct hook echo and forward flank downdraft are present in ZH data, a ZDR arc is observed on the eastern side of the forward flank downdraft. HV reveals evidence of debris caused by the tornado at 21:03 UTC. As the storm continued northward, another arc of high ZDR and low HV is seen where the outflow boundary of the storm is located, which is linked with a second tornado. | |||
==References== | |||
Kumjian, M. R., and A. V. Ryzhkov, 2009: Storm-relative helicity revealed from polarimetric radar measurements. J. Atmos. Sci., 66, 667–685. | |||
Kumjian, M. R., and A. V. Ryzhkov, 2012: The impact of size sorting on the polarimetric radar variables. J. Atmos. Sci., 69, 2042–2060. | |||
Revision as of 10:35, 29 June 2016
Authors: Nathan B. Deuschle and Dr. Wendilyn Flynn, University of Northern Colorado
Overview
This article presents an analysis of dual polarization parameters and their evolution during a tornadic supercell thunderstorm that occurred on May 7th, 2016 near the town of Wiggins, Colorado. The presence of a strong mesocyclone was established in an earlier analysis of Doppler velocities.
Arcs of high differential reflectivity (Zdr)
|
|
||
|
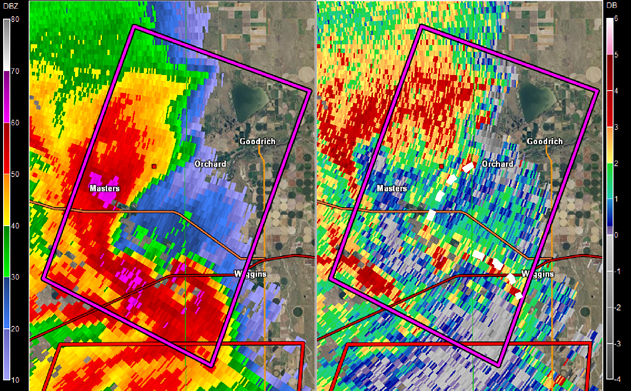
An interesting low-level ZDR signature known as the ZDR arc (Kumjian and Ryzhkov 2009, 2012) is observed within the above loop of ZH and ZDR from 20:54 UTC to 21:03 UTC. The ZDR arc can be seen where the white dashed lines are located starting to the southeast of Orchard. High ZDR values between 1.0 and 4.0 dB are observed within the arc, which exists along the eastern side of the forward flank downdraft of this storm. The ZDR arc forms as a result of size sorting of the hydrometeors on their descent due to vertical wind shear (Kumjian and Ryzhkov 2009, 2012). Larger hydrometeors fall out along the inflow edge of the forward flank downdraft, while smaller hydrometeors are transported further downstream. As a result of the size sorting, higher KDP values can be observed to the left of the ZDR arc. This can be seen in the images of KDP and ZDR below. A separate, secondary arc of enhanced ZDR is also observed, indicated by the white dashed lines that start just to the west of Wiggins. Low values of the correlation coefficient (HV) within this zone suggest that this arc of high ZDR is associated with the rear flank downdraft gust front.
Horizontal Reflectivity, Differential Reflectivity, and Specific Differential Propagation Phase Analysis


Above are plots of horizontal reflectivity (ZH), differential reflectivity (ZDR), and specific differential propagation phase (KDP) at 21:03 UTC when a well-defined hook echo was present, and tornado was confirmed according to the SPC severe weather archive. Local reservoirs, highways, and towns are overlaid.
To the south of the marker and over Empire Reservoir, ZDR values are in the range of 0 to -2 dB, KDP values are around .82 to 1.91 deg/km, and ZH values are above 60 dBZ. The combination of these parameters suggests the presence of large hail in this region of the rear flank downdraft. North/northeast of Masters and over the Riverside Reservoir we see a bull’s-eye of high KDP values ~3.0 deg/km, with ZDR values 0 to 0.5 dB, and ZH values of above 60 dBZ. This would indicate that melting hail is falling in this part of the forward flank downdraft. To the north and west of Masters, ZDR values are much larger, around 4.0 dB, also coinciding with high horizontal reflectivities (ZH) and high KDP values, indicating that large, oblate raindrops are falling in this area of the forward flank downdraft.
Evidence of debris

When looking at the above snapshot of the correlation coefficient (HV) at 21:03 UTC, evidence of debris can be seen in the vicinity of the hook echo (marked at the X). HV values below 0.8 exist at the marker, which indicates that these are non-meteorological targets. This corresponds with where we expect the tornado to be located when looking at the hook echo in the ZH image and the tornado vortex signature in a velocity image. The earlier Doppler analysis contained a velocity couplet observed from CHILL and KFTG. Large, negative values of ZDR are seen in this area as well, which also points to the presence of debris, as negative ZDR values indicate a larger vertical than horizontal orientation of a target. The NWS damage survey documented instances of large trees blown over, damage to trailers near Empire Reservoir, and power lines toppled with this event, so it is reasonable to conclude that debris was lofted with this circulation.
Evidence of Biological Targets/Gust Front and Second Tornado


At 21:41 UTC, this supercell has progressed northward into Weld County. Another arc of high ZDR values (~4.0 dB) and low HV values (<0.8) appears, which indicates that biological or non-meteorological targets are detected here. The RHI scan below from 21:49 UTC and the images above show that this arc of high ZDR and low HV is along the leading edge of a gust front. The marker in the RHI scan is located where the enhanced ZDR values are located, just ahead of the highest reflectivities, where we would expect an outflow boundary or gust front. This gust front appears to link the circulation in our supercellular storm with another circulation marked near the X in the above image. This circulation was documented in the NWS damage survey as a separate tornado
Summary
The tornadic supercell thunderstorm that occurred on May 7th 2016 near the town of Wiggins, Colorado exhibited many interesting features when looking at the evolution of the dual polarization parameters. Many different sizes and types of hydrometeors (and non-hydrometeors) can be determined when analyzing ZH, KDP, and ZDR together. While a distinct hook echo and forward flank downdraft are present in ZH data, a ZDR arc is observed on the eastern side of the forward flank downdraft. HV reveals evidence of debris caused by the tornado at 21:03 UTC. As the storm continued northward, another arc of high ZDR and low HV is seen where the outflow boundary of the storm is located, which is linked with a second tornado.
References
Kumjian, M. R., and A. V. Ryzhkov, 2009: Storm-relative helicity revealed from polarimetric radar measurements. J. Atmos. Sci., 66, 667–685. Kumjian, M. R., and A. V. Ryzhkov, 2012: The impact of size sorting on the polarimetric radar variables. J. Atmos. Sci., 69, 2042–2060.