DPWX/Tornadic supercell thunderstorm: 7 May 2016
Overview
Near 2100 UTC on 7 May 2016 a confirmed tornado occurred at a range of ~45 km to the southeast of the CSU-CHILL radar. The radar was conducting PPI sector volume scans of this area as the tornado developed. This article presents a few data plots selected from the early stages of the tornadic period.
Pre-warning period (2039 - 2041 UTC)
The following plot shows the CSU-CHILL reflectivity data in a 6.5 degree elevation PPI scan that ended at 2039:31 UTC. As indicated, a bounded weak echo region (BWER) was present just north of I-76. These localized echo minima in thunderstorms occur when strong updrafts loft growing hydrometeors to higher altitudes. For geographic reference, the black dots on the shorelines of Empire Reservoir mark two of the locations where tornado damage was documented by an NWS post-storm survey.

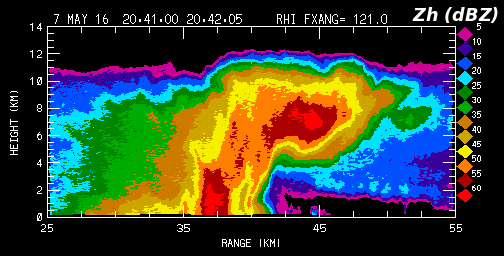
The next plot shows the reflectivity data observed in an RHI scan taken through the BWER region on an azimuth of 121 degrees at 2041 UTC. The overhanging echo structure is evident at a range of ~45 km.
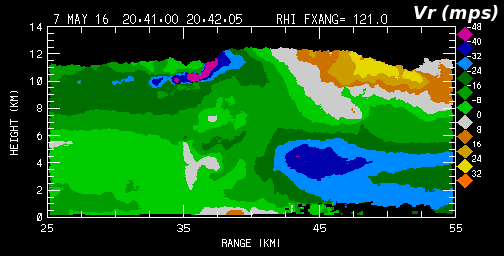
The corresponding de-aliased radial velocity field is shown in the next plot. Strong (> 35 mps) velocities inbound to the storm exist at heights below ~6 km. Divergence is indicated in the somewhat domed storm top structure near range = 43 km. This general upper level divergence surmounting lower level convergence implies that organized updrafts were occurring in the general BWER / suspended reflectivty core near range=45 km, height=7.5 km AGL. A few minutes after this RHI scan (2046 UTC), the NWS issued a tornado warning based on a radar indicated rotation located 5 miles west of Wiggins and moving north at 35 mph.
Mesocyclone observations near 2103 UTC
Severe weather spotter reports archived by the Storm Predication Center show that a multi-vortex tornado was observed crossing I-76 at 2100 UTC. The following two plots show the associated low level cyclonic rotation couplets as observed by the CSU-CHILL and NWS KFTG radars at ~2103 UTC. (For reference, three NWS damage survey points in the immediate Empire Reservoir area are marked with black dots.) The northerly storm motion was more nearly aligned with the KFTG viewing direction. As a result, the strongest radial velocities (outbound in excess of 40 mps) were seen in the KFTG data.
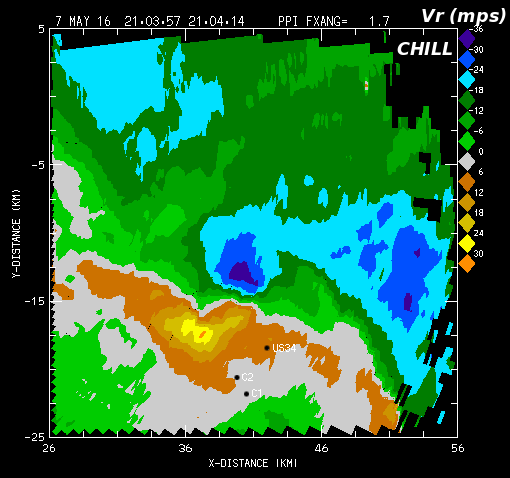
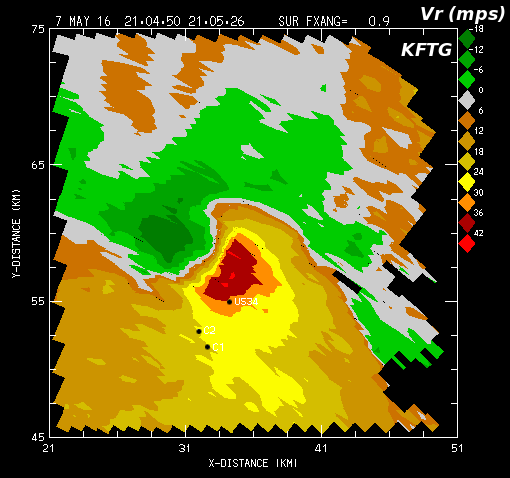
(The CHILL volume started at 2103:40 UTC, the KFTG volume started at 2103:56 UTC). Earth-relative horizontal wind vectors and CHILL reflectivity data at the 3 km MSL height level. Analysis time is 2105 UTC.
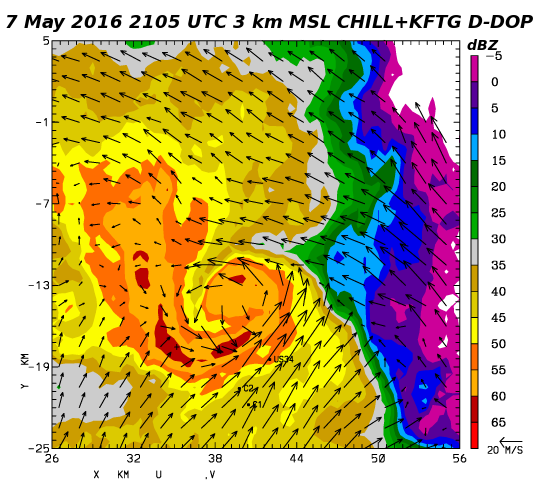
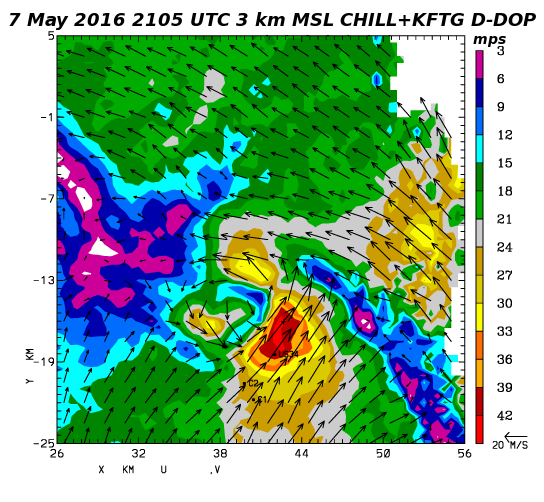
Horizontal wind speed analysis based on the dual-Doppler U and V components. Three localized wind speed maxima were present in the mesocyclone region at this single time snapshot. Northward storm motion probably contributed to the maxima that contained the highest speeds (> 40 mps).
