DPWX/Thunderstorm electrification signature: 18 June 2013
Overview
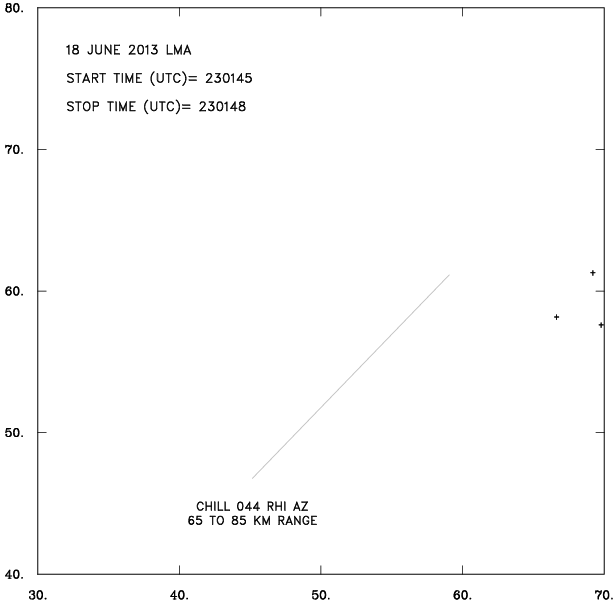
Thunderstorms, some of which were severe, developed in several portions of the CSU-CHILL radar's coverage area during the afternoon hours of 18 June 2013. Around 2300 UTC, a number of RHI scans were conducted through a storm that was located near the triple point formed where the state boundaries of Colorado, Nebraska and Wyoming meet (located approximately 65 km north-northeast of CHILL). The following plot shows the CSU-CHILL S-band reflectivity data obtained in a low elevation PPI scan just before the RHI scanning was started. The corresponding Zdr data (not shown), indicated that hail was present in much of the high reflectivity core. The red line segment shows the location of a selected portion of the 044 degree azimuth RHI plane.

044 deg RHI scan data
The next plot shows the the S-band reflectivity data collected in an RHI scan on an azimuth of 044 degrees. As shown by the red line in the preceding PPI plot, this RHI was located ~10 to 15 km to the southeast (rear) of the reflectivity core.

The S-band differential propagation phase data from the same RHI sweep is presented in the next plot. At near-surface levels, where the propagation path includes an appreciable component of oblate raindrops, the color progression with increasing range is in a downward direction along the color bar (i.e., dull yellow to bright yellow). In the upper portion of the echo, between heights of ~8 - 10 km AGL, the color progression with range is in the opposite (upscale, dull yellow to green) direction; indicating that asymmetric ice particles have their major axes oriented towards the vertical. Prior research has shown that sufficiently strong electric fields rotate ice crystals from their aerodynamically stable horizontal orientation towards a direction that aligns with the local electric field lines.

The next plot shows the corresponding X-band phidp data; the color scale is the same as was used in the S-band phase data plot. Since phidp sensitivity is inversely proportional to wavelength, the magnitude of the color scale excursions at X-band are amplified relative to those seen at S-band. The X-band phase pattern also suggests that the ice crystal orientation becomes more horizontal in narrow layers located just above and below the main negative phase shift altitude band. This suggests that the overall charge structure produces curved electric field lines that locally favor both horizontal as well as vertical ice crystal orientations.

KFTG - KCYS dual-Doppler wind synthesis

|
|
||
|