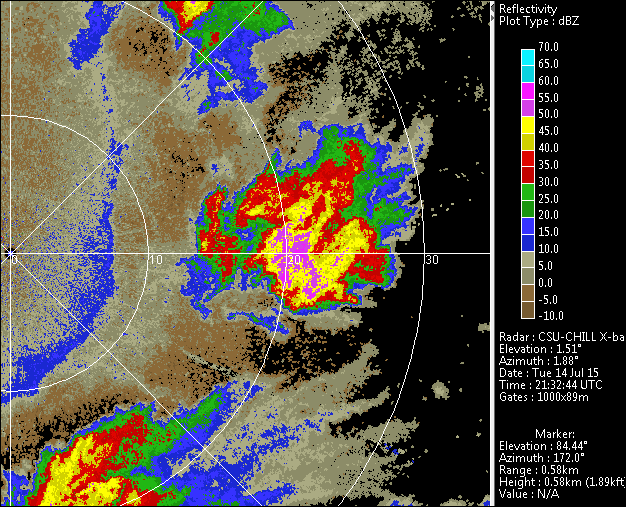
On 14 July 2015, the S-band portion of the CSU-CHILL radar was out of service, so data collection was limited to the X-band portion of the radar. 360 degree low level elevation angle (1.5 deg) surveillance scans were started near 2132 UTC as thunderstorms developed within 30 km range. One storm located ~18 km east of the radar showed a well-defined increase in maximum reflectivity between 2132 and 2142 UTC. As this echo core intensified, and rain rates increased, signatures of attenuation and differential attenuation became increasingly apparent in the down-range portions of the echo.
Reflectivity loop
The following loop shows the reflectivity data in a sequence of eight PPI scans at ~1 minute and 40 second intervals. In the final three frames, radially-aligned areas of reduced reflectivity begin to appear at ranges beyond the high reflectivity regions. These signal reductions are due to the attenuation that the X-band radar waves experience as they propagate through the heavy rain areas. This propagation loss diminishes the intensity of the radar illumination available in the areas beyond the intense cores, producing the radially-aligned reduced-reflectivity "shadows".