DPWX/Street flooding and hail in Ft. Collins: 22 May 2018: Difference between revisions
Pat kennedy (talk | contribs) No edit summary |
Pat kennedy (talk | contribs) (Starting text entry.) |
||
| Line 1: | Line 1: | ||
==Overview== | |||
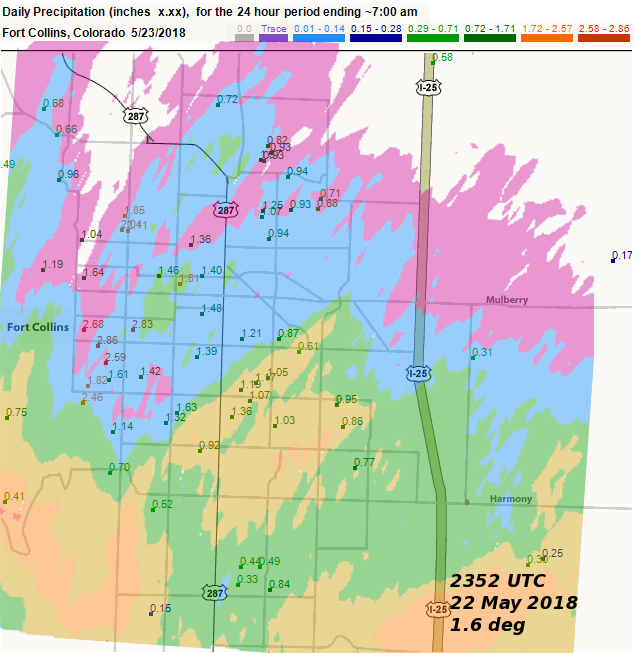
A thunderstorm produced a combination of very high rain rates and ground-covering hail accumulations over portions of Fort Collins Colorado around 6 PM local time on 22 May 2018. This intense precipitation resulted in traffic disruptions due to accumulations of standing water in a number of low-lying streets. The hailstone concentrations were also high enough deposit a considerable amount of leaf debris below the trees in many neighborhoods. Since the Collaborative Community Rain, Hail and Snow (CoCoRaHS) network was originally developed in the Fort Collins area, a number of observing sites have been established in the area affected by this storm. The following plot shows the precipitation totals filed by CoCoRaHS volunteer observers in the Fort Collins area; these precipitation totals are for the 24 hour period ending around 7 AM local time on the morning following the storm. (Most, but not all, of the precipitation fell during the early evening thunderstorm.) Several reports of rain totals in excess of 2.5 inches were received from the west-central portion of the city. (For reference, the red dot marks the general location of the reflectivity core seen in the CHILL radar RHI scan shown at the top of this article.) | |||
[[Image:CoCoRaHS base 284 40 anot_V2.png|center]] | [[Image:CoCoRaHS base 284 40 anot_V2.png|center]] | ||
==CSU-CHILL radar PPI scan data== | |||
Test operations of the S-band (11 cm wavelength) portion of the CSU-CHILL radar were being conducted as the storm affected Fort Collins. The following plot shows the reflectivity data collected in a 1.9 degree elevation scan over the city area at 0011 UTC (locally, 1811 MDT on the 22nd). A 10 dB contour interval was used in generating the plot; red shading indicates reflectivity levels at or above 60 dBZ. | |||
[[Image:23may2018 0011 1.9deg raw dz anot.png|center]] | [[Image:23may2018 0011 1.9deg raw dz anot.png|center]] | ||
To better associate the CHILL reflectivity data with the CoCoRaHS data, the following loop shows a series of low elevation angle PPI sweeps plotted as a semi-transparent overlay on the rain fall reports. The high reflectivity area intensified and moved over the western portion of the city in a time period of 30 - 40 minutes. | |||
<center> | <center> | ||
Revision as of 05:50, 13 June 2018
Overview
A thunderstorm produced a combination of very high rain rates and ground-covering hail accumulations over portions of Fort Collins Colorado around 6 PM local time on 22 May 2018. This intense precipitation resulted in traffic disruptions due to accumulations of standing water in a number of low-lying streets. The hailstone concentrations were also high enough deposit a considerable amount of leaf debris below the trees in many neighborhoods. Since the Collaborative Community Rain, Hail and Snow (CoCoRaHS) network was originally developed in the Fort Collins area, a number of observing sites have been established in the area affected by this storm. The following plot shows the precipitation totals filed by CoCoRaHS volunteer observers in the Fort Collins area; these precipitation totals are for the 24 hour period ending around 7 AM local time on the morning following the storm. (Most, but not all, of the precipitation fell during the early evening thunderstorm.) Several reports of rain totals in excess of 2.5 inches were received from the west-central portion of the city. (For reference, the red dot marks the general location of the reflectivity core seen in the CHILL radar RHI scan shown at the top of this article.)

CSU-CHILL radar PPI scan data
Test operations of the S-band (11 cm wavelength) portion of the CSU-CHILL radar were being conducted as the storm affected Fort Collins. The following plot shows the reflectivity data collected in a 1.9 degree elevation scan over the city area at 0011 UTC (locally, 1811 MDT on the 22nd). A 10 dB contour interval was used in generating the plot; red shading indicates reflectivity levels at or above 60 dBZ.

To better associate the CHILL reflectivity data with the CoCoRaHS data, the following loop shows a series of low elevation angle PPI sweeps plotted as a semi-transparent overlay on the rain fall reports. The high reflectivity area intensified and moved over the western portion of the city in a time period of 30 - 40 minutes.
|
|
||
|