DPWX/Severe thunderstorm activity near CSU-CHILL: 29 July 2016
Overview
During the afternoon hours of Friday, 29 July 2016 severe thunderstorms developed in the area around Cheyenne, Wyoming. These storms produced several reports of damaging hail. As the late afternoon progressed, this storm complex tracked south-southeastward approximately towards the CSU-CHILL radar site. Additional reports of severe (1 inch or larger diameter) hail were received as the storms approached Greeley. Hail with maximum diameters of approximately 2.54 cm (1 inch) fell at the CSU-CHILL site near 1900 MDT (0100 UTC on 30 July). The storm complex continued to generate hail and heavy rain as it moved into the southeast quadrant of the radar. This article presents photographs and radar data images selected from various stages of the event.
Observations near 0040 UTC
At 0041 UTC the approaching thunderstorms contained a prominent lowered cloud base with limited visual indications of precipitation. Such wall cloud features typically mark areas of well-organized thunderstorm inflow supplying strong updrafts (ref). In this case, local rotation was not evident in the wall cloud. (The CSU-CHILL radar azimuth to the barn in the center of the image is ~3XX degrees).

The following PPI scan was taken four minutes later (0045 UTC) at an elevation angle of X.X degrees. The wall cloud was located in the vicinity of the reflectivity "notch" near the town of Ault. The radar azimuth to Ault is 3XX degrees.

The corresponding radial velocity image is shown in the following plot. Low-level outflow was evident in the southwest (right flank) portion of the storm:

Observations near 0056 UTC
By 0056 UTC the remnants of the wall cloud were located just north-northwest of the radar site. A sun-illuminated indentation into the more distant (western) side of the wall cloud suggested the local intrusion of drier air.

The reflectivity data at essentially the same time is presented in the next image. The white plus signs mark the locations and diameters (in inches) of Storm Prediction Center severe weather spotter reports from the 0051 - 0105 UTC time period:

The corresponding Zdr data shows a well-defined area of ~0 dB or less values in the vicinity of the confirmed hail reports. This Zdr regime occurs where the tumbling hailstone motions yield similar received signal levels at both horizontal (H) and vertical (V) polarizations. In the surrounding echo areas where rain predominates, the oblate drop shapes cause the H signal levels to exceed the V levels, producing positive Zdr values.

The correlation coefficient between the H and V signal returns (rhoHV) was appreciably reduced in the hail area. This is indicative of a mixture of hailstones and raindrops within the radar pulse volume. The hail diameters were also large enough to promote some additional correlation reductions due to Mie scattering effects.

0102 UTC RHI data
As the storm began to affect the radar site, an RHI scan on an azimuth angle of 328 degrees was done with a maximum elevation limit of 89 degrees (i.e., essentially vertically pointing). The reflectivity structure showed that the forward overhang portion of the storm was above the radar this time. In this overhang, the radial velocity contained a small area of positive / away from the radar / upward hydrometeor motions located at a height of ~9 km AGL above the radar. Very strong inbound (negative) velocities (magnitudes of ~45 mps) were evident just to the northwest of the radar near the 45 degree elevation angle (both range and height approximately = 6 km):

The following image shows some of the larger diameter hailstones that fell at the CSU-CHILL site during the storm passage. The stones were generally of high density with multiple observations of the stones bouncing off of the ground; very little evidence of stone shattering were seen. Following the storm passage, hailstone coverage of the ground was sparce.

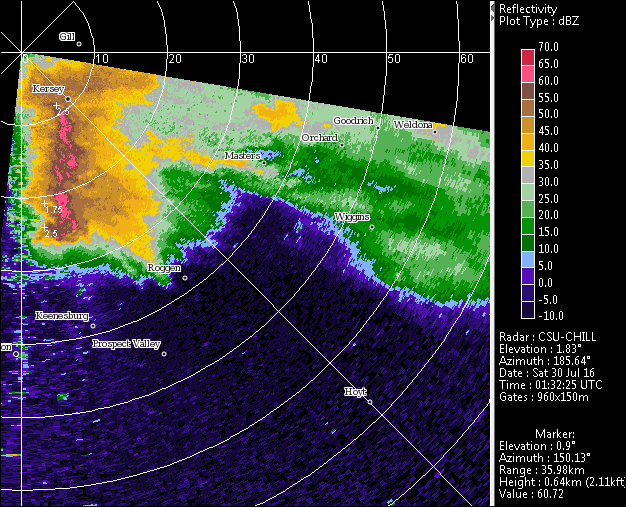
0130 to 0206 UTC reflectivity image loop
|
|
||
|