DPWX/Selected dual wavelength observations of hail: 12 June 2017: Difference between revisions
Pat kennedy (talk | contribs) No edit summary |
Pat kennedy (talk | contribs) No edit summary |
||
| Line 1: | Line 1: | ||
==Overview== | |||
Several severe thunderstorms affected the northwestern half of the CSU-CHILL coverage area on 12 June 2017. Initially, the primary severe weather aspect of these storms was large (> 1 inch diameter) hail. Later, as the activity crossed over the Wyoming state line, several tornadoes were reported. A number of the hail reports were made by volunteer observers in the Community Collaborative Rain, Hail, and Snow (CoCoRaHS) network. One such observer noted an episode of irregularly-shaped hailstones (including both "lumpy" and "flying saucer" shapes) at a location ~30 km northwest of the CSU-CHILL radar just before 2100 UTC. CSU-CHILL scans in both PPI and RHI mode were made through the storm that passed over the CoCoRaHS observer's location. Selected radar data plots associated with the cooperative observer's hail report are shown below. | |||
==PPI scan and photographic data: 2057 - 2103 UTC== | |||
The low-level echo situation is shown in the following constant height (2.8 km MSL / 1.4 km AGL) plot. At the analysis time (2057 UTC), reflectivity levels of ~55 dBZ were present at the observer's location in the southwestern portion of the echo core. The horizontal wind vectors were synthesized from the radial velocities observed by CHILL and NWS Cheyenne (KCYS) radars. Strong (~ 20 mps) inflow was occurring on the southeastern side of the echo system. | |||
[[Image:12jun2017 2.8km ddop anot.png|center]] | [[Image:12jun2017 2.8km ddop anot.png|center]] | ||
A photograph of the clouds and precipitation occurring to the northwest of the CHILL site at approximately this same time (2103 UTC) is shown next. The lowered, visually rain-free cloud base is consistent with a strong updraft associated with the well organized inflow seen in the dual Doppler wind field. | |||
| Line 5: | Line 16: | ||
The final 2.8 km MSL CAPPI plot shows contours of the Hail Differential Reflectivity (HDR) parameter calculated from the gridded CSU-CHILL radar data. HDR identifies areas where the presence of hailstones lowers differential reflectivity (Zdr) relative to the Zdr level that would be expected if the precipitation was composed only of raindrops (Aydin et. al, JAMC, 1987). Positive HDR values are associated with an increasing hail probability. Positive HDR values were present at the CoCoRaHS observer's location at this time. | |||
[[Image:12jun2017 2.8km HDR anot.png|center]] | |||
The CoCoRaHS observer provided a photograph of one of the irregular hailstones that was collected at ~2058 UTC. Rounded lobes characterize much of the main stone's outer surface. The irregularity of this particular stone is further enhanced by a prominent lump visible in the lower left corner. It appears that this lump may be a smaller ice particle that became fused with the larger hailstone. In any event, the overall shape is an appreciable departure from the spheroidal forms that are often assumed for hailstones. | |||
| Line 14: | Line 28: | ||
==S-band RHI scan data at 2055 UTC== | |||
The following collection of plots selected S-band data fields from an RHI scan done on an azimuth of 303 degrees at 2054 UTC. (The location of this RHI plane is shown in the preceding HDR plot). These plots are best viewed by stepping ahead using the "Fwd" screen button. | |||
<center> | <center> | ||
Revision as of 15:25, 18 December 2017
Overview
Several severe thunderstorms affected the northwestern half of the CSU-CHILL coverage area on 12 June 2017. Initially, the primary severe weather aspect of these storms was large (> 1 inch diameter) hail. Later, as the activity crossed over the Wyoming state line, several tornadoes were reported. A number of the hail reports were made by volunteer observers in the Community Collaborative Rain, Hail, and Snow (CoCoRaHS) network. One such observer noted an episode of irregularly-shaped hailstones (including both "lumpy" and "flying saucer" shapes) at a location ~30 km northwest of the CSU-CHILL radar just before 2100 UTC. CSU-CHILL scans in both PPI and RHI mode were made through the storm that passed over the CoCoRaHS observer's location. Selected radar data plots associated with the cooperative observer's hail report are shown below.
PPI scan and photographic data: 2057 - 2103 UTC
The low-level echo situation is shown in the following constant height (2.8 km MSL / 1.4 km AGL) plot. At the analysis time (2057 UTC), reflectivity levels of ~55 dBZ were present at the observer's location in the southwestern portion of the echo core. The horizontal wind vectors were synthesized from the radial velocities observed by CHILL and NWS Cheyenne (KCYS) radars. Strong (~ 20 mps) inflow was occurring on the southeastern side of the echo system.

A photograph of the clouds and precipitation occurring to the northwest of the CHILL site at approximately this same time (2103 UTC) is shown next. The lowered, visually rain-free cloud base is consistent with a strong updraft associated with the well organized inflow seen in the dual Doppler wind field.

The final 2.8 km MSL CAPPI plot shows contours of the Hail Differential Reflectivity (HDR) parameter calculated from the gridded CSU-CHILL radar data. HDR identifies areas where the presence of hailstones lowers differential reflectivity (Zdr) relative to the Zdr level that would be expected if the precipitation was composed only of raindrops (Aydin et. al, JAMC, 1987). Positive HDR values are associated with an increasing hail probability. Positive HDR values were present at the CoCoRaHS observer's location at this time.

The CoCoRaHS observer provided a photograph of one of the irregular hailstones that was collected at ~2058 UTC. Rounded lobes characterize much of the main stone's outer surface. The irregularity of this particular stone is further enhanced by a prominent lump visible in the lower left corner. It appears that this lump may be a smaller ice particle that became fused with the larger hailstone. In any event, the overall shape is an appreciable departure from the spheroidal forms that are often assumed for hailstones.

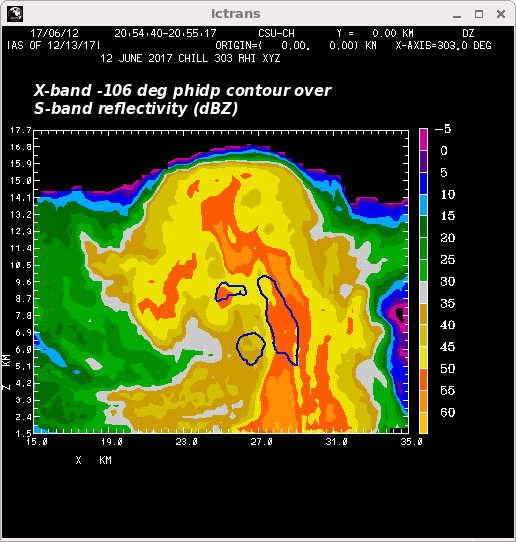
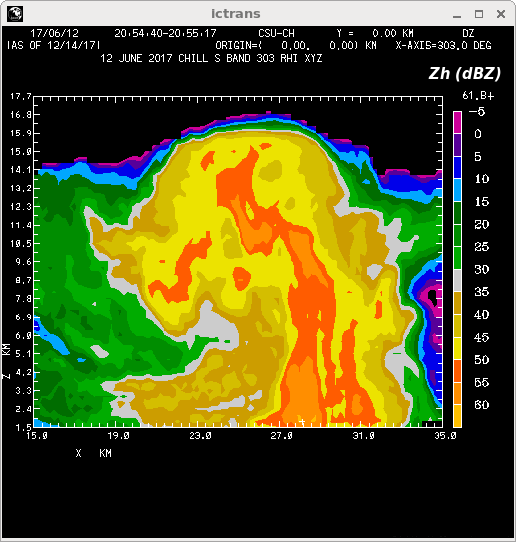
S-band RHI scan data at 2055 UTC
The following collection of plots selected S-band data fields from an RHI scan done on an azimuth of 303 degrees at 2054 UTC. (The location of this RHI plane is shown in the preceding HDR plot). These plots are best viewed by stepping ahead using the "Fwd" screen button.
|
|
||
|

|
|
||
|