DPWX/Overshooting thunderstorm top: 4 June 2015: Difference between revisions
Pat kennedy (talk | contribs) No edit summary |
Pat kennedy (talk | contribs) No edit summary |
||
| Line 1: | Line 1: | ||
==Overview== | |||
Several thunderstorms developed in the CSU-CHILL radar coverage area around 00 UTC on 4 June 2015. The most intense storm was in the vicinity of Elizabeth, Colorado at a range of ~100 km from CHILL. Due to the beam curvature effects at this long range, CHILL radar observations at near surface height levels were not possible. Data collected at the storm top / anvil cloud level showed the patterns of intense divergence and overshooting cloud tops that are associated with strong updrafts. The following XX degree angle PPI scan shows the storm's location at YYYY UTC: | |||
==Echo configuration near 0010 UTC== | |||
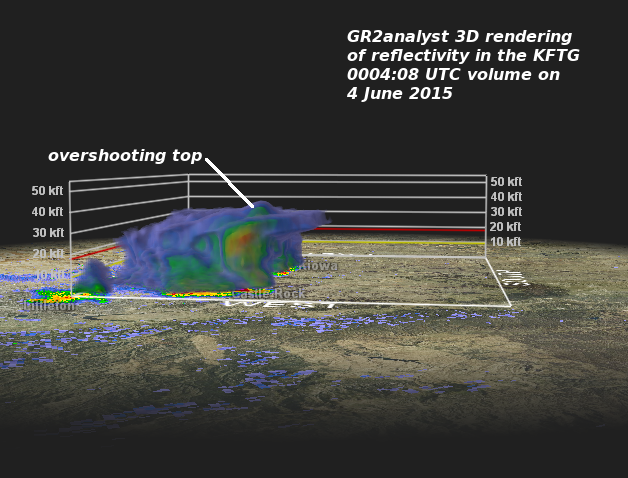
The range to the Elizabeth storm from the NWS KFTG (Denver) radar was only ~ 50 km, allowing this radar to more completely survey the echo system. The following plot shows a 3D rendering of the storm's structure generated by the GR2analyst software package from the KFTG 004:08 volume scan. In this plot the storm is being viewed from its western side. The strong updraft associated with the echo core locally elevated the echo summit above the general anvil top level. | |||
[[Image:Kftg 20150604 0004 anot.png|center]] | [[Image:Kftg 20150604 0004 anot.png|center]] | ||
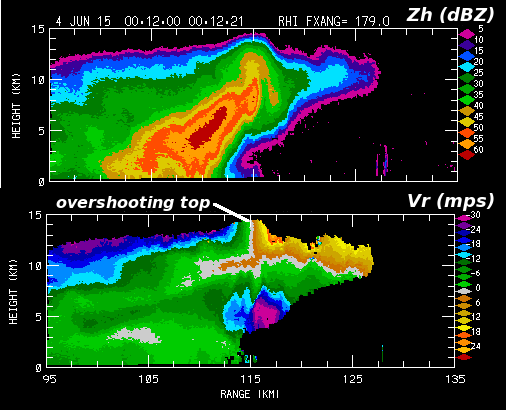
Approximately 8 minutes later, the CSU-CHILL radar conducted an RHI scan that intercepted the overshooting top echo. The radial velocity pattern in the overshooting top (negative / inbound velocities on the near-range side and positive / outbound velocities on the far-range side) shows strong divergence driven by the updraft's interaction with the increased static stability at the tropopause. The > 20 mps magnitude mid-level inflow on the storm's southern edge and the overhanging reflectivity configuration in the RHI plane also indicate that the storm contained a strong updraft. | |||
[[Image:4jun2015 0012 2 panel RHI anot.png|center]] | [[Image:4jun2015 0012 2 panel RHI anot.png|center]] | ||
==Echo configuration near 0045 UTC== | |||
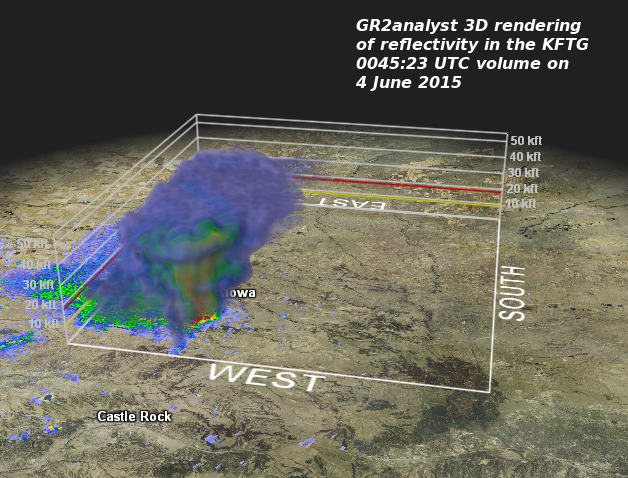
The storm remained intense throughout the 00 UTC hour. The following 3D rendering was generated from the 0045:23 UTC KFTG volume scan. The maximum echo top heights continued to occur along the storm's southwestern flank. | |||
[[Image:Kftg 20150604 0045 anot.png|center]] | [[Image:Kftg 20150604 0045 anot.png|center]] | ||
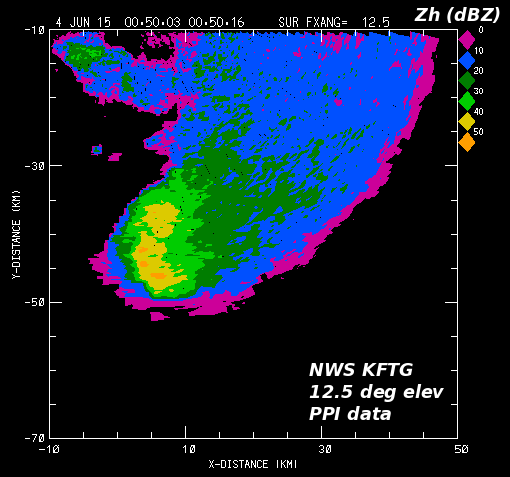
The next two plots show the reflectivity and radial velocity patterns in the 12.5 degree elevation angle sweep of the KFTG 0045:23 UTC volume scan. The general "kidney bean" shape of the echo within the 30 dBZ (bright green) reflectivity region suggests that the horizontal airflow is locally accelerated as the air passes the echo core and enters the downstream anvil. | |||
[[Image:4jun2015 | [[Image:KFTG 4jun2015 0050 12.5deg ppi z anot.png|center]] | ||
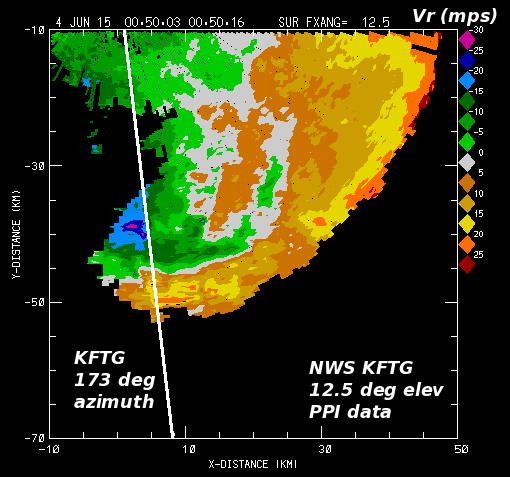
The KFTG 12.5 deg elevation angle PPI sweep captured the divergent radial velocity pattern in the upper levels of the storm. | |||
[[Image:KFTG 4jun2015 0050 12.5deg ppi v anot.png|center]] | |||
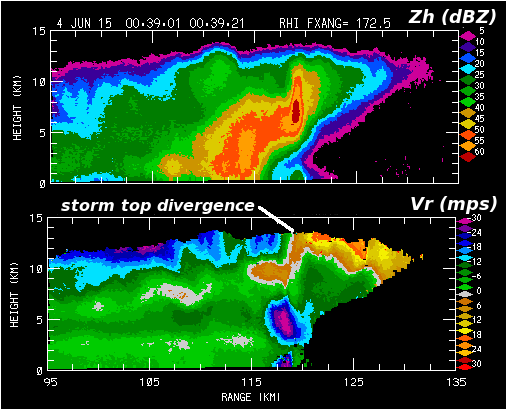
A more detailed view of the storm's vertical structure was obtained in a CSU-CHILL RHI scan done at 0040 UTC. The overhanging echo configuration continued to be present. | |||
[[Image:4jun2015 0038 2 panel RHI anot.png|center]] | |||
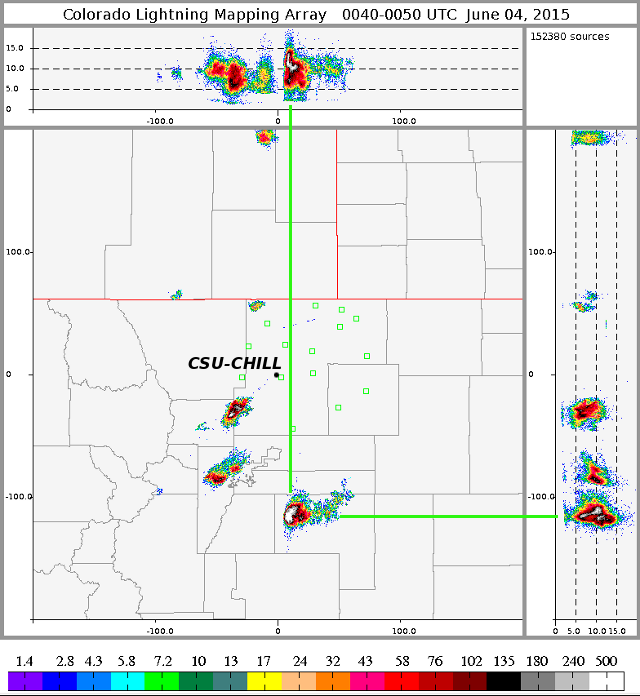
While the overshooting top echo was less evident on the CHILL 0040 UTC RHI, the GOES East visible satellite image from ~0050 UTC showed considerable overshooting activity in the southwestern portion of the anvil. | |||
[[Image:4jun2015 0040 0050 density anot.png|center]] | [[Image:4jun2015 0040 0050 density anot.png|center]] | ||
Revision as of 04:54, 28 August 2015
Overview
Several thunderstorms developed in the CSU-CHILL radar coverage area around 00 UTC on 4 June 2015. The most intense storm was in the vicinity of Elizabeth, Colorado at a range of ~100 km from CHILL. Due to the beam curvature effects at this long range, CHILL radar observations at near surface height levels were not possible. Data collected at the storm top / anvil cloud level showed the patterns of intense divergence and overshooting cloud tops that are associated with strong updrafts. The following XX degree angle PPI scan shows the storm's location at YYYY UTC:
Echo configuration near 0010 UTC
The range to the Elizabeth storm from the NWS KFTG (Denver) radar was only ~ 50 km, allowing this radar to more completely survey the echo system. The following plot shows a 3D rendering of the storm's structure generated by the GR2analyst software package from the KFTG 004:08 volume scan. In this plot the storm is being viewed from its western side. The strong updraft associated with the echo core locally elevated the echo summit above the general anvil top level.
Approximately 8 minutes later, the CSU-CHILL radar conducted an RHI scan that intercepted the overshooting top echo. The radial velocity pattern in the overshooting top (negative / inbound velocities on the near-range side and positive / outbound velocities on the far-range side) shows strong divergence driven by the updraft's interaction with the increased static stability at the tropopause. The > 20 mps magnitude mid-level inflow on the storm's southern edge and the overhanging reflectivity configuration in the RHI plane also indicate that the storm contained a strong updraft.
Echo configuration near 0045 UTC
The storm remained intense throughout the 00 UTC hour. The following 3D rendering was generated from the 0045:23 UTC KFTG volume scan. The maximum echo top heights continued to occur along the storm's southwestern flank.
The next two plots show the reflectivity and radial velocity patterns in the 12.5 degree elevation angle sweep of the KFTG 0045:23 UTC volume scan. The general "kidney bean" shape of the echo within the 30 dBZ (bright green) reflectivity region suggests that the horizontal airflow is locally accelerated as the air passes the echo core and enters the downstream anvil.
The KFTG 12.5 deg elevation angle PPI sweep captured the divergent radial velocity pattern in the upper levels of the storm.
A more detailed view of the storm's vertical structure was obtained in a CSU-CHILL RHI scan done at 0040 UTC. The overhanging echo configuration continued to be present.
While the overshooting top echo was less evident on the CHILL 0040 UTC RHI, the GOES East visible satellite image from ~0050 UTC showed considerable overshooting activity in the southwestern portion of the anvil.
