DPWX/Modeling observed drop size distributions: 23 May 2015
Introduction
From April 2015, a six-month rain measurement campaign was initiated at the Easton site 13 km SSE from the CHILL radar site. The campaign involved (i) a 2-D video disdrometer [2DVD, Shönhuber et al., 2008], (ii) a droplet spectrometer called the meteorological particle spectrometer [MPS, Baumgardner et al., 2002], (iii) a Pluvio raingauge [OTT Messtechnik GmbH, 2010], and (iv) a precipitation occurrence sensor system [POSS, Sheppard and Joe, 2008]) all installed within a 2/3rd scaled DFIR double wind fence that was originally installed for the MASCRAD snow observation project [Ref: MASCRAD web article]. Many events were recorded by the ground instruments, and for several of these events, a near-complete picture of the rain drop size spectra (from very small to large drops) were derived, by combining the MPS measurements for small drops (< 1 mm) and the 2DVD measurements for larger drops. The shapes of the combined drop size distribution (DSD) spectra had pointed to the need for more flexible model to represent the full DSD [Thurai et al., 2017; Thurai and Bringi, 2017] rather than the standard gamma model. Here we consider a formulation based on the generalized gamma model, previously considered in [Lee et al., 2004 and Raupach and Berne, 2017] for rain DSDs. Specifically, equation (43) in [Lee et al., 2004] is used to derive/fit the four parameters, by setting i=3 and j=4, i.e. using the third and the fourth moments. Here we show a selected case event that occurred on 23 May 2015 which for 90 minutes over Easton, resulting in a total event accumulation of 15 mm. Large drops were recorded by the 2DVD. One example is given below (constructed from the 2DVD front and side view contours).

A summary of the DSD measurements from the 2DVD are shown below. Around 20:45 UTC, wide DSD spectra can be seen with drop diameters ranging up to 5 mm and higher.

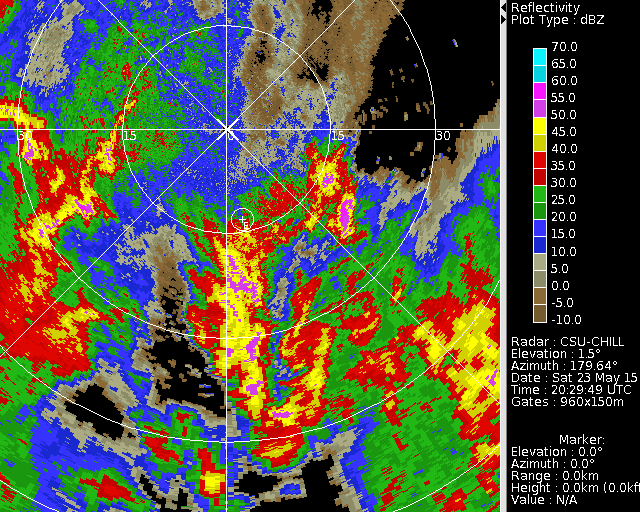
Reflectivity loop
The following loop shows the CSU-CHILL S-band reflectivity data collected in a series of 1.5 degree elevation angle 360 degree survei
|
|
||
|
|
|
||
|
|
|
||
|


|
|
||
|


