DPWX/Hail signatures at X-band: 24 May 2016: Difference between revisions
Pat kennedy (talk | contribs) No edit summary |
Pat kennedy (talk | contribs) (Starting text insertion.) |
||
| Line 1: | Line 1: | ||
==Overview== | |||
Thunderstorms developed in several portions of the CSU-CHILL radar's coverage area during the afternoon hours of 24 May 2016. Near 2200 UTC, the focus of the radar scanning shifted to a storm that was developing near the NWS KFTG radar (located ~75 km to the south-southeast of CSU-CHILL). According to Storm Prediction Center records, reports of one inch diameter hail were received at 2217 and 2231 UTC from the path of this storm. Since hailstone diameters larger than ~1 to 1.5 cm are large enough to develop Mie scattering resonance effects at a wavelength of 3 cm; selected samples of CSU-CHILL X-band data were examined for indications of Mie scattering. | |||
==RHI scan at 2155 UTC== | |||
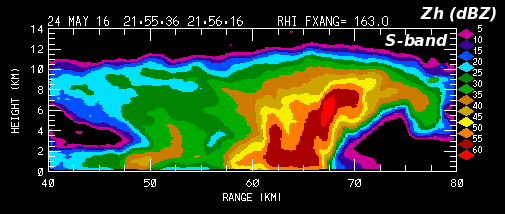
The following two images show the vertical storm structure as depicted by the S-band reflectivity and radial velocity fields. The reflectivity data showed a deep, high reflectivity core with a forward overhang at ~70 km range. | |||
[[Image:24may2016 2155 sb zh anot.png]] | [[Image:24may2016 2155 sb zh anot.png]] | ||
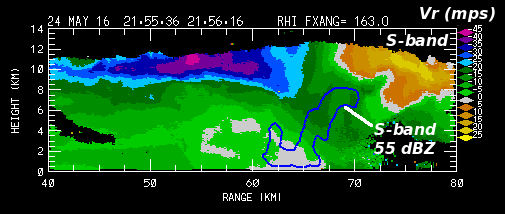
The unfolded radial velocity field contained a well-define low level convergence / storm top divergence pattern, implying the existence of a strong updraft in the vicinity of the forward overhang (indicated by the blue 55 dBZ contour line overlay.) | |||
[[Image:24may2016 2155 sb vt anot.png]] | [[Image:24may2016 2155 sb vt anot.png]] | ||
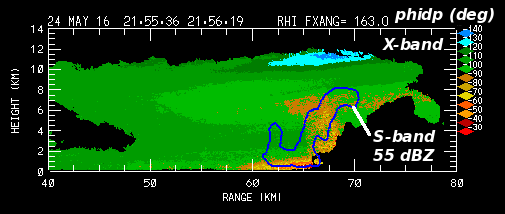
The next two plots show the corresponding X-band data. For reference, the S-band 55 dBZ reflectivity contour is also included. The color fill shows the X-band differential propagation phase (phidp) data. The primary feature of interest is the vertical swath of tan / yellow (> -90 degrees) phidp values that extends across the 55 dBZ S-band reflectivity contour. At ranges on either side of this feature, phidp values are more negative (green shades). Mie scattering increases the magnitude of differential phase shift upon scattering. This is typically manifest as a local positive perturbation in the range profile of phidp. (See Figure 1d in Tromel et al, JAMC, November 2013). Thus, the observation of this "delta column" indicates that hail diameters large enough to enter the Mie scattering regime at X-band are probably present in this portion of the RHI plane. | |||
[[Image:24may2016 2155 xb phidp ovly anot.png]] | [[Image:24may2016 2155 xb phidp ovly anot.png]] | ||
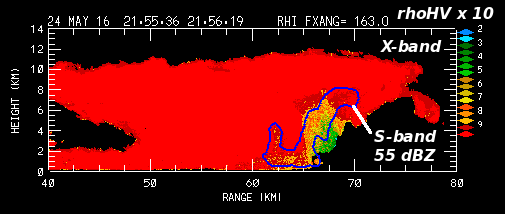
The final RHI plot shows the X-band rhoHV multiplied by 10. An area of significantly lowered rhoHV occurred in the same general region as the delta signature. Since Mie resonance effects also are effective at reducing rhoHV, this localized reduction in correlation is an additional indication of the existence of ice particles with diameters that are a relatively large fraction of the X-band (3 cm) wavelength. | |||
[[Image:24may2016 2155 xb rho ovly anot.png]] | [[Image:24may2016 2155 xb rho ovly anot.png]] | ||
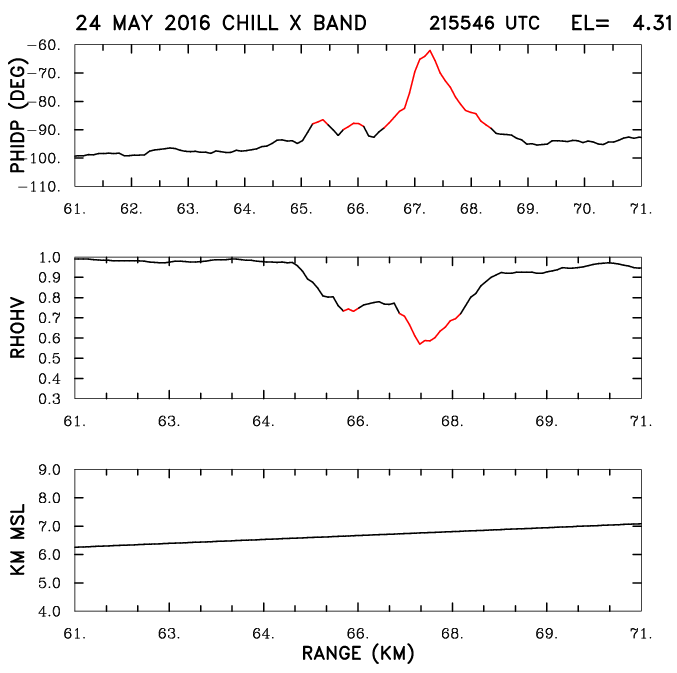
The next plot shows the range profiles of phidp, rhoHV and beam height (in km MSL) along a single ray of X-band data in the RHI scan. The red color highlights the ~65 - 69 km range interval where the delta bump and rhoHV dip patterns were observed. The bottom plot panel shows that the height of this data ray was just over 6 km MSL in the Mie scattering area. | |||
[[Image:24may2016 4.31 delta ray.png]] | [[Image:24may2016 4.31 delta ray.png]] | ||
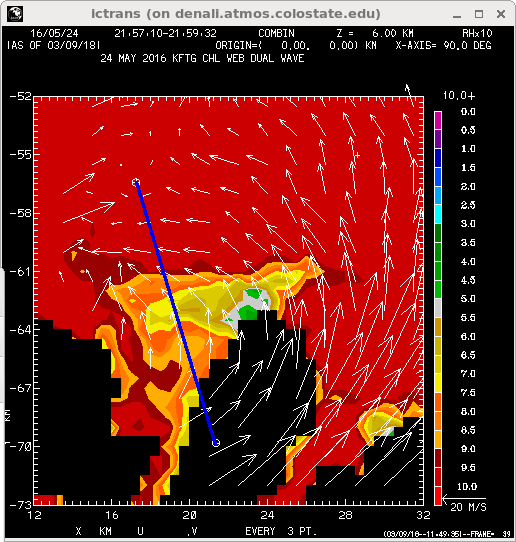
==KFTG and CSU-CHILL dual Doppler analysis at 2157 UTC== | |||
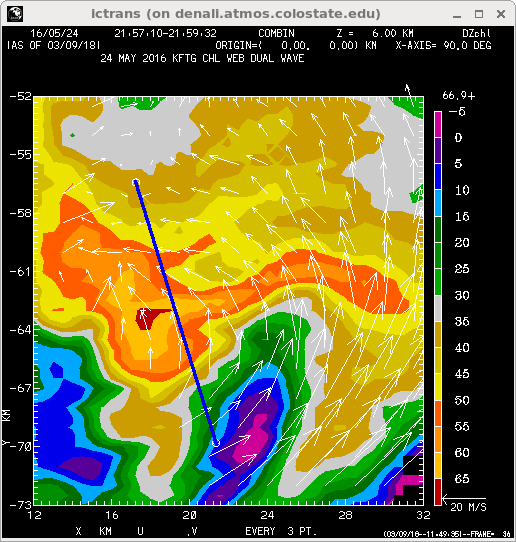
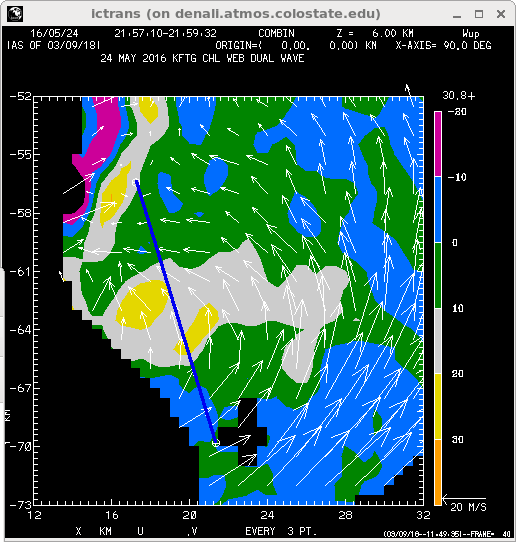
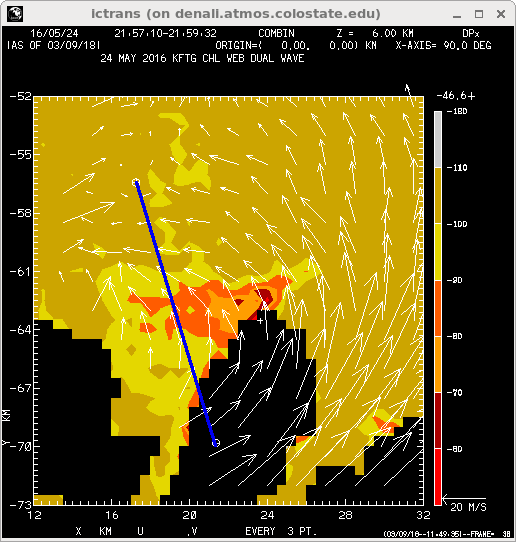
Blue line segment is range 59 to 73 km on the CHILL 163 deg azimuth. (Azimuth of the RHI and ray plots shown above.) | Blue line segment is range 59 to 73 km on the CHILL 163 deg azimuth. (Azimuth of the RHI and ray plots shown above.) | ||
Revision as of 14:20, 29 March 2018
Overview
Thunderstorms developed in several portions of the CSU-CHILL radar's coverage area during the afternoon hours of 24 May 2016. Near 2200 UTC, the focus of the radar scanning shifted to a storm that was developing near the NWS KFTG radar (located ~75 km to the south-southeast of CSU-CHILL). According to Storm Prediction Center records, reports of one inch diameter hail were received at 2217 and 2231 UTC from the path of this storm. Since hailstone diameters larger than ~1 to 1.5 cm are large enough to develop Mie scattering resonance effects at a wavelength of 3 cm; selected samples of CSU-CHILL X-band data were examined for indications of Mie scattering.
RHI scan at 2155 UTC
The following two images show the vertical storm structure as depicted by the S-band reflectivity and radial velocity fields. The reflectivity data showed a deep, high reflectivity core with a forward overhang at ~70 km range.
The unfolded radial velocity field contained a well-define low level convergence / storm top divergence pattern, implying the existence of a strong updraft in the vicinity of the forward overhang (indicated by the blue 55 dBZ contour line overlay.)
The next two plots show the corresponding X-band data. For reference, the S-band 55 dBZ reflectivity contour is also included. The color fill shows the X-band differential propagation phase (phidp) data. The primary feature of interest is the vertical swath of tan / yellow (> -90 degrees) phidp values that extends across the 55 dBZ S-band reflectivity contour. At ranges on either side of this feature, phidp values are more negative (green shades). Mie scattering increases the magnitude of differential phase shift upon scattering. This is typically manifest as a local positive perturbation in the range profile of phidp. (See Figure 1d in Tromel et al, JAMC, November 2013). Thus, the observation of this "delta column" indicates that hail diameters large enough to enter the Mie scattering regime at X-band are probably present in this portion of the RHI plane.
The final RHI plot shows the X-band rhoHV multiplied by 10. An area of significantly lowered rhoHV occurred in the same general region as the delta signature. Since Mie resonance effects also are effective at reducing rhoHV, this localized reduction in correlation is an additional indication of the existence of ice particles with diameters that are a relatively large fraction of the X-band (3 cm) wavelength.
The next plot shows the range profiles of phidp, rhoHV and beam height (in km MSL) along a single ray of X-band data in the RHI scan. The red color highlights the ~65 - 69 km range interval where the delta bump and rhoHV dip patterns were observed. The bottom plot panel shows that the height of this data ray was just over 6 km MSL in the Mie scattering area.
KFTG and CSU-CHILL dual Doppler analysis at 2157 UTC
Blue line segment is range 59 to 73 km on the CHILL 163 deg azimuth. (Azimuth of the RHI and ray plots shown above.)
