DPWX/Gust front observations: 7 May 2017

CSU-CHILL S-band reflectivity data collected in a 2.3 degree elevation angle PPI scan just after a strong gust front passed the radar site. Time lapse loops of selected PPI and RHI scan data collected as the gust front moved away from the radar have been prepared.
Overview
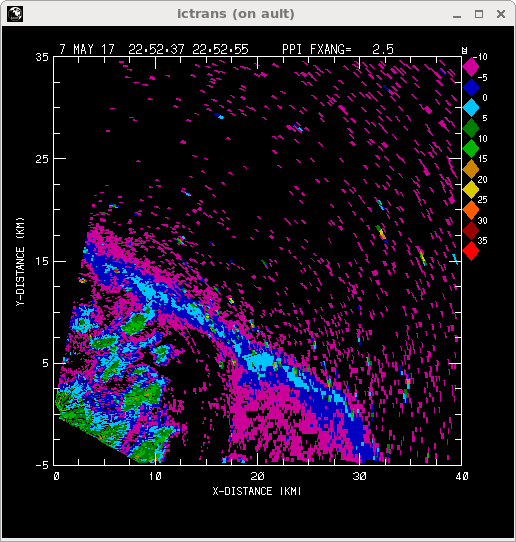
The collection of radar observations of the low-level outflows generated by thunderstorms was one of the objectives of Prof. S. van den Heever's C3LOUD Ex (CSU Convective Cloud Outflows and UpDrafts Experiment). During project operations on 7 May 2017, a dissipating area of thunderstorms located to the southwest of the radar generated a well-defined gust front that began to affect the radar site near 2240 UTC. After the initial surface wind shift, wind speeds increased dramatically, with the automated weather observing equipment recording a peak wind from 220 degrees at 45 knots at 2301 UTC. Convergence along the leading edge of this outflow concentrated the weak boundary layer scatterers (primarily insects), producing a fine line echo that was detectable by the CSU-CHILL radar. (Surface dust and debris raised by the strong winds also contributed to the radar returns). The following image loop shows a sequence of low elevation angle PPI sector scans that were done as the fine line echo propagated rapidly away from the radar towards the northeast.
PPI scan reflectivity
|
|
||
|
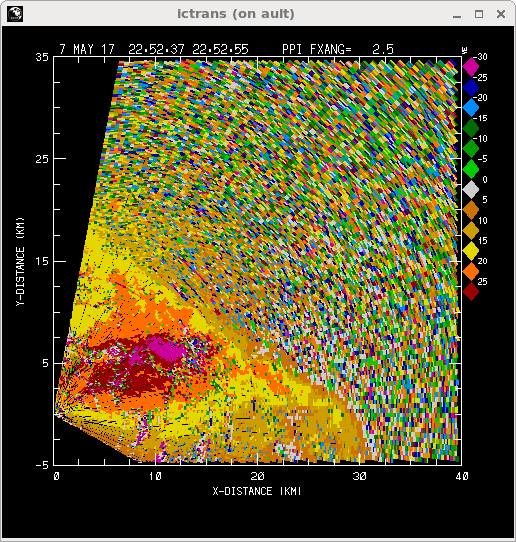
PPI scan radial velocity

|
|
||
|
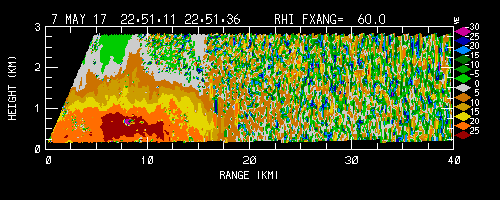
RHI scan reflectivity
|
|
||
|
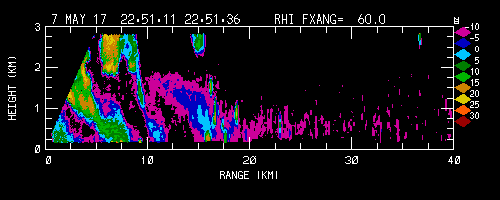
RHI scan radial velocity
|
|
||
|