DPWX/Evolution of dual polarization and radial velocity fields in low-level PPI scans through a thunderstorm cluster: 5 July 2018
Overview
During the afternoon hours of 5 July 2018 the CSU-CHILL radar conducted operations in support of an X-band weather radar that was being tested at the CHILL site. To support data comparisons, both radars conducted PPI sector scans at the same low elevation angles. These scans were oriented towards an area where thunderstorms were developing in at ranges of approximately 40 km to the southwest of Greeley. The radar data collected between 2204 and 2255 UTC captured the development of new convection at the northern end of the initial thunderstorm cluster.
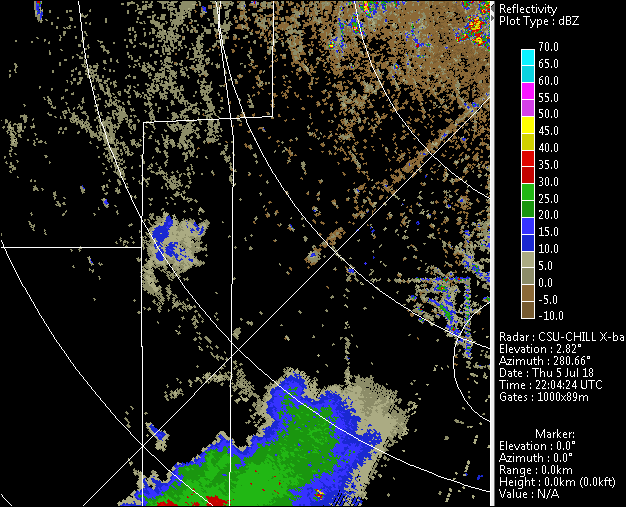
Reflectivity loop
The following image loop of X-band data was generated from a series of 0.5 degree elevation angle PPI scans done by the CSU-CHILL at essentially one minute time intervals. (An ~ 1 minute time gap occurred at 2214 UTC when an RHI scan was done between loop frames 11 and 12.) One echo of interest initially appears as a weak, isolated echo near the triple point formed by the boundaries of Boulder, Larimer, and Weld counties. With time, the reflectivity in this cell exceeds 50 dBZ as the precipitation shaft matures. During the later stages of the loop, outflow from the storm produces a fine line echo that propagates northwestward from the expanding thunderstorm complex. By the end of the loop, new reflectivity cores that are apparently related to this propagating boundary appear near the southern border of Larimer County.
|
|
||
|
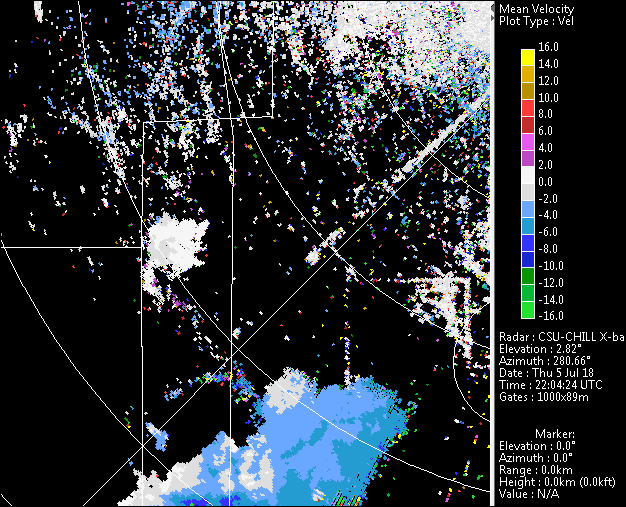
Radial velocity loop
The following loop shows the radial velocities from the same series of PPI scans. Indications of convergence are initially present in the developing stage of the northern cell. Divergence becomes well-defined during the subsequent high reflectivity period. Additional divergence / microburst signatures also appear in the southern portion of the echo complex. The radial velocity in the overall echo system becomes generally divergent with time.
|
|
||
|
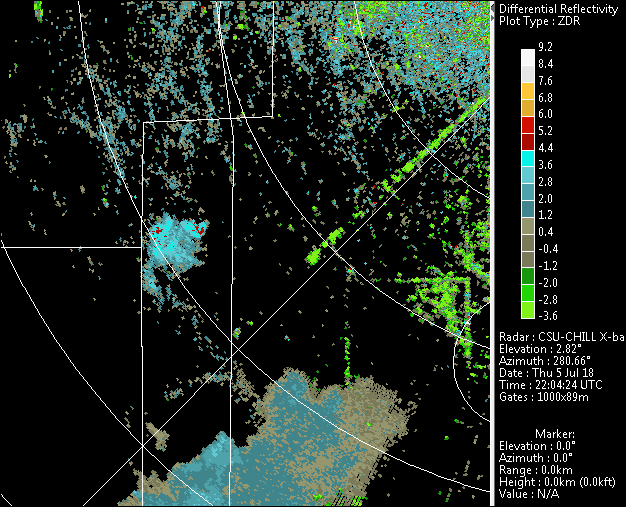
Differential reflectivity loop
The differential reflectivity data shows the evolution of the reflectivity-weighted mean axis ratios of the precipitation particles. The most positive (+4 to +5 dB) Zdr's occur in the early development of the precipitation shafts. This is probably due to the few, relatively large diameter, higher fall speed "big drops" that initially comprise the developing rain shaft. Any continuing updrafts augment this drop sorting process by retarding the descent of smaller, more spherically shaped drops. As the rain shaft matures and the smaller diameter, more spherical portion of the drop size distribution fills in, the Zdr values decrease to the +2 to +3 dB levels that are typically associated with heavy rain in continental regions. Finally, differential attenuation causes negative Zdr "shadows" to appear down range of the heavy rain areas where high concentrations of oblate raindrops exist.
|
|
||
|
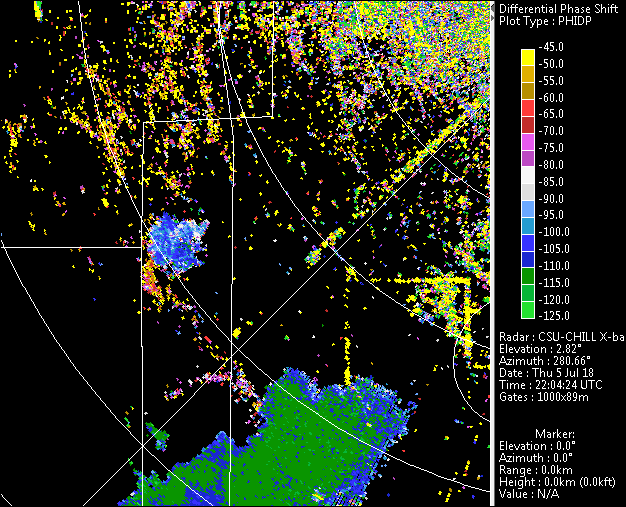
Differential propagation phase loop
The final loop shows the differential propagation phase (phidp) data. This variable is the difference between phases of the signals in the horizontal and vertical polarization receiver channels. As the concentration of oblate hydrometeors along the radar beam path increases, the propagation of horizontally-polarized microwaves become increasingly retarded relative to vertically polarized waves traveling along the same path. In the following loop frames, range segments where the phidp values move upward along the color scale (i.e., from green and blue towards red and yellow) indicate the presence of heavy rain. These large phase shift areas appear after the "big drop" initial precipitation period. These regions of high phidp change with respect to range (specific differential propagation phase (Kdp)) are closely associated with areas where differential attenuation signatures developed in the preceding Zdr loop.
|
|
||
|
Time history
