DPWX/Dual Doppler analysis of horizontal winds in a thunderstorm anvil: 12 June 2017
Overview
During the afternoon hours of 12 June 2017 several severe thunderstorms moved across the northwestern half of the CSU-CHILL coverage area. The Storm Prediction Center spotter reports included hailstone diameters of 4.25 inches near Pierce Colorado at 2200 UTC and confirmed tornado activity beginning just south of Hereford at 2250 UTC. CSU-CHILL radar observations of the thunderstorm activity was primarily done using PPI sector volume scans. Two sweep RHI volumes were also done to examine microphysically interesting areas. By coincidence, the CSU-CHILL and the NWS Cheyenne WSR-88D radars both started volume scans at 2208:47 UTC. This pair of synchronized volume scans formed the input to a dual Doppler analysis using the NCAR CEDRIC software package. This presentation primarily considers the dual-Doppler based horizontal wind field patterns in the anvil portion of the echo system.
The following plot shows the the CSU-CHILL reflectivity and unfolded radial velocity fields in the 6.2 degree elevation sweep of the 2208:47 volume. This elevation angle intercepted both two intense reflectivity cores as well as their extensive downstream anvil echo. The radial velocities are almost entirely positive (i.e., away from the radar). The radial velocity magnitudes varied across the anvil region, with some areas exceeding +45 mps.

Dual Doppler and Lightning Mapping Array analyses at 9 km MSL
The 9 km MSL level captured several interesting features in terms of both the dual-Doppler derived horizontal winds and the Lightning Mapping Array (LMA) data. The horizontal winds were synthesized from the unfolded radial velocities recorded by the KCYS and CSU-CHILL radars in their respective 2208:47 UTC volume scans. The radar data was interpolated to a common 3D Cartesian gridpoint network with a 500 m mesh size; the grid origin is located at CSU-CHILL. Based on the mean echo motion from the south-southwest, the gridded radar data was advected to an analysis time of 2210 UTC.
The 3D locations of lightning discharges were observed by the Northern Colorado Lightning Mapping Array (LMA) system. The individual stations in the LMA network record the arrival times of VHF discharges that are most commonly generated as negatively charged stepped leaders propagate into regions of positive charge. The differences in the discharge arrival times across the LMA station network allow the 3D location of the discharge to be determined with high resolution in space and time (Thomas et al 2004).
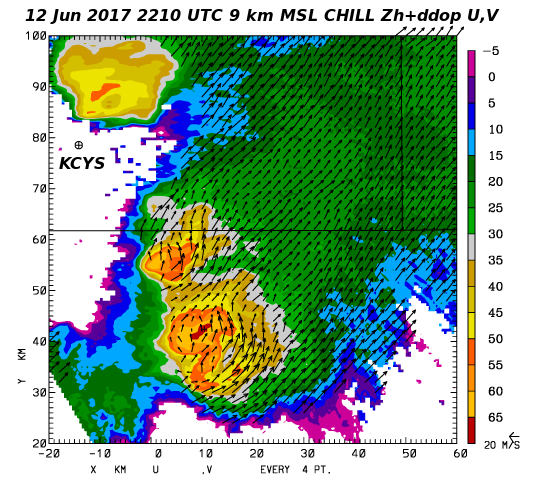
The following "animation" interface provides a sequence of four presentations of radar and LMA data at the 9 km MSL level:
Frame 1: Earth-relative horizontal wind vectors plotted over the CSU-CHILL reflectivity contour field. Maximum reflectivities exceed 60 dBZ in the two storms of interest. The northern storm was crossing the Colorado-Wyoming border, while the larger southern storm was located ~40 km north of CHILL. An extensive region of lower reflectivity anvil echo extended towards the northeast into both Wyoming and Nebraska. Locally accelerated cyclonic flow perturbations were present near the southern flanks of the two thunderstorm cores.
Frame 2: LMA
|
|
||
|