DPWX/Downburst evolution: 18 July 2016: Difference between revisions
Pat kennedy (talk | contribs) (Initial image posting) |
Pat kennedy (talk | contribs) (Starting text entries.) |
||
| Line 1: | Line 1: | ||
==Overview== | |||
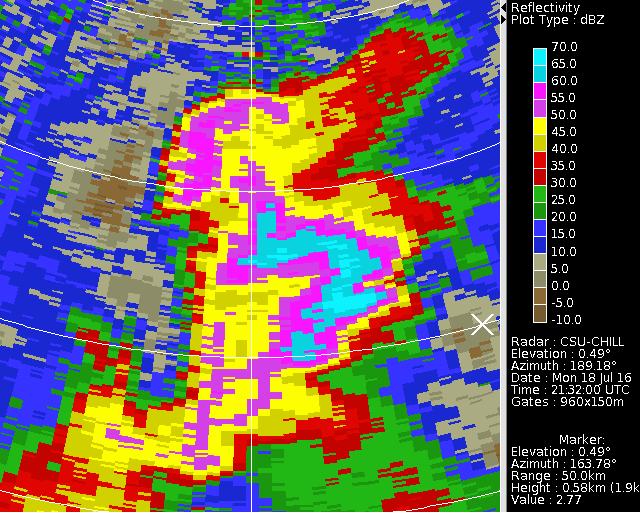
During the afternoon hours of 18 July 2016, thunderstorms developed in several portions of the CSU-CHILL radar's coverage area. During the 2100 - 2130 UTC time period, 0.5 degree elevation angle surveillance scans were done at time intervals of ~ 3 minutes. These low elevation angle scans captured the evolution of a localized divergence pattern in the radial velocity data generated by one of the thunderstorms. Dual polarization data showed the existence of heavy rain in association with the divergence signature. | |||
The color fill in the following plot shows the radial velocity field at 2120:44 UTC. The data shown in the plot has been interpolated to a Cartesian grid with the points spaced at 500 m intervals in the X and Y directions on the PPI scan surface. The double-ended arrow segment along the CHILL 187 degree radial indicates the divergence signature. The arrow length is 6 km; at this time the divergence pattern size had recently expanded beyond the 4 km size scale that defines a microburst. The black reflectivity contours depict the thunderstorm cell that was generating the low level outflow. | |||
[[Image:18jul2016 2120 0.5deg div arrow anot.png|center]] | [[Image:18jul2016 2120 0.5deg div arrow anot.png|center]] | ||
Revision as of 06:36, 25 January 2018
Overview
During the afternoon hours of 18 July 2016, thunderstorms developed in several portions of the CSU-CHILL radar's coverage area. During the 2100 - 2130 UTC time period, 0.5 degree elevation angle surveillance scans were done at time intervals of ~ 3 minutes. These low elevation angle scans captured the evolution of a localized divergence pattern in the radial velocity data generated by one of the thunderstorms. Dual polarization data showed the existence of heavy rain in association with the divergence signature.
The color fill in the following plot shows the radial velocity field at 2120:44 UTC. The data shown in the plot has been interpolated to a Cartesian grid with the points spaced at 500 m intervals in the X and Y directions on the PPI scan surface. The double-ended arrow segment along the CHILL 187 degree radial indicates the divergence signature. The arrow length is 6 km; at this time the divergence pattern size had recently expanded beyond the 4 km size scale that defines a microburst. The black reflectivity contours depict the thunderstorm cell that was generating the low level outflow.
Reflectivity contour overlay
|
|
||
|
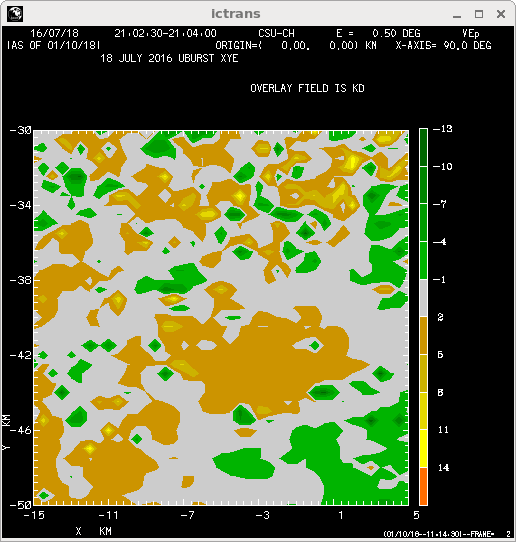
KDP contour overlay
|
|
||
|
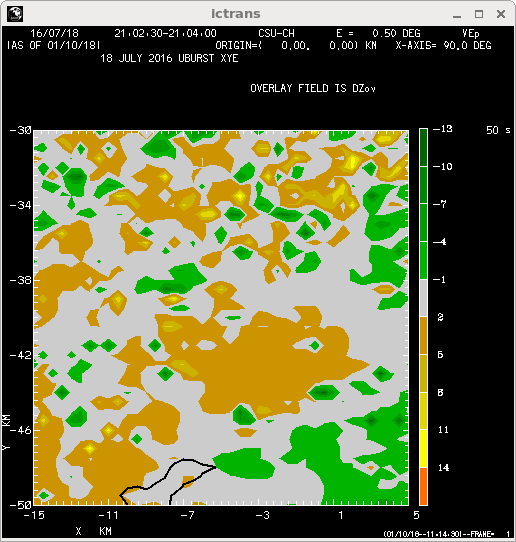
X-band signal extinction
|
|
||
|